Glimpse of what you can do with vRNI?
vRNI has humongous amount of data in the form of versioned, granular and strongly connected configuration graph, flows, metrics, alerts, application definitions etc. owing to which vRNI is like a treasure trove that has something for every type of user persona.
A detailed demo of vRNI can stretch over several hours, so instead we will take a sneak preview of a few usecases which should help you extrapolate.
Say you are an application admin, and you have already added all the datasources and have defined the application and its tiers, for instance this application:
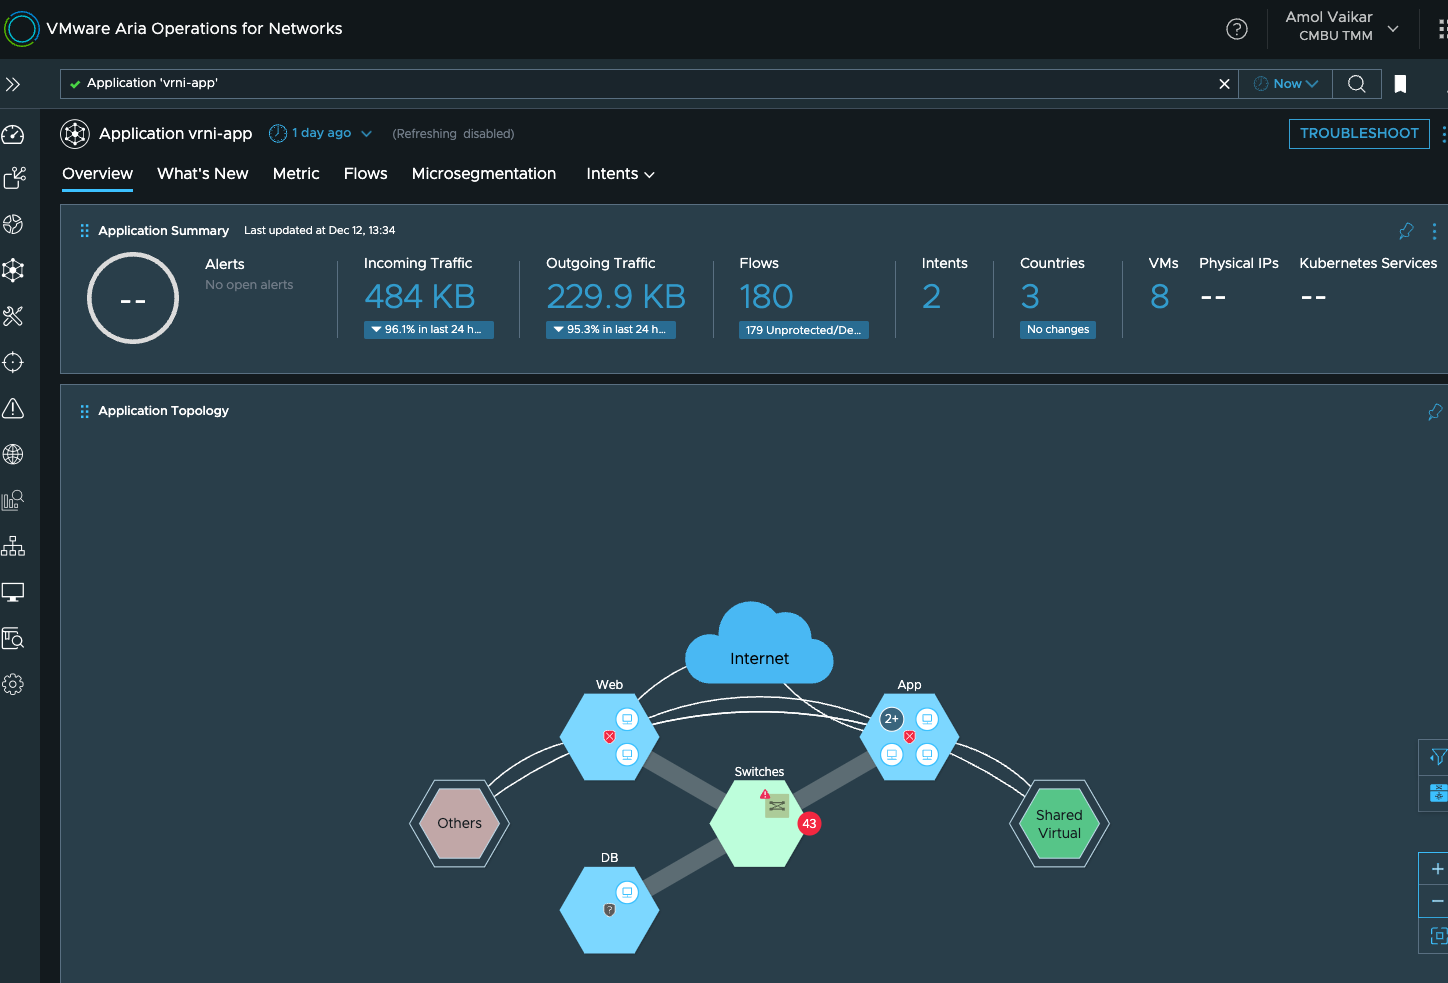
Now obviously I cant keep monitoring the application dashboard continuously, but say I want to know when the network performance of this application deteriorates below a certain threshold, so for such scenarios, we have threshold analytics, and here I have created one for Round trip time metrics between application tiers:
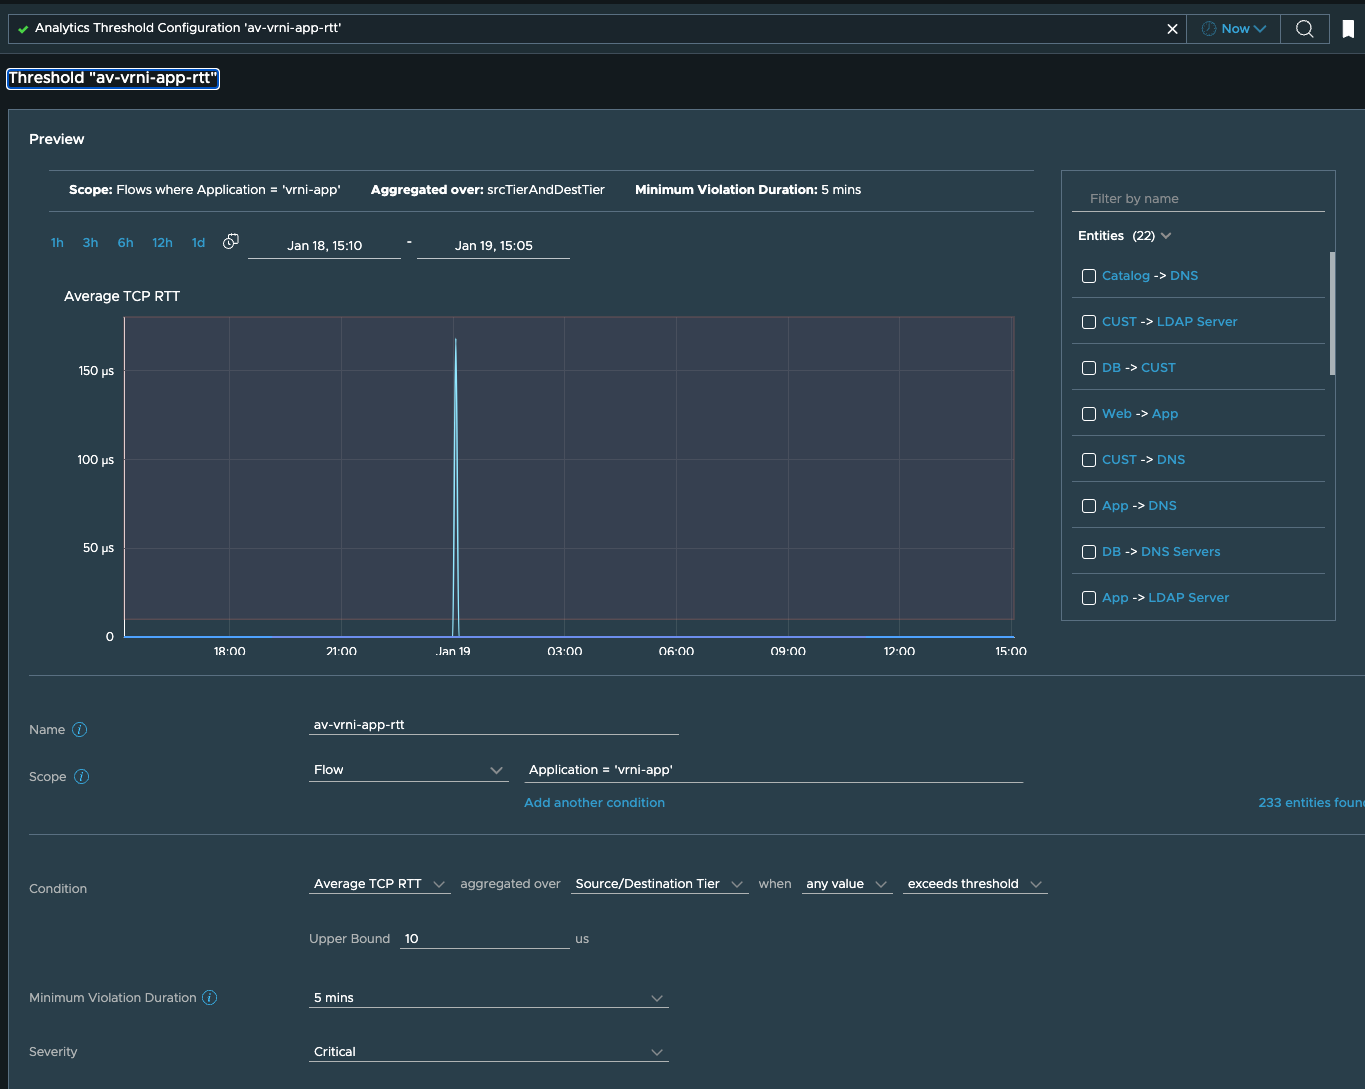
In threshold we now see that web to app tier rtt seems to be very high,
this will anyways generate an alert.
So now I want to find why the rtt is so high between these two tiers, so
I go back to the application and find the flows associated with these
tiers, so that I can see what network path these are taking.
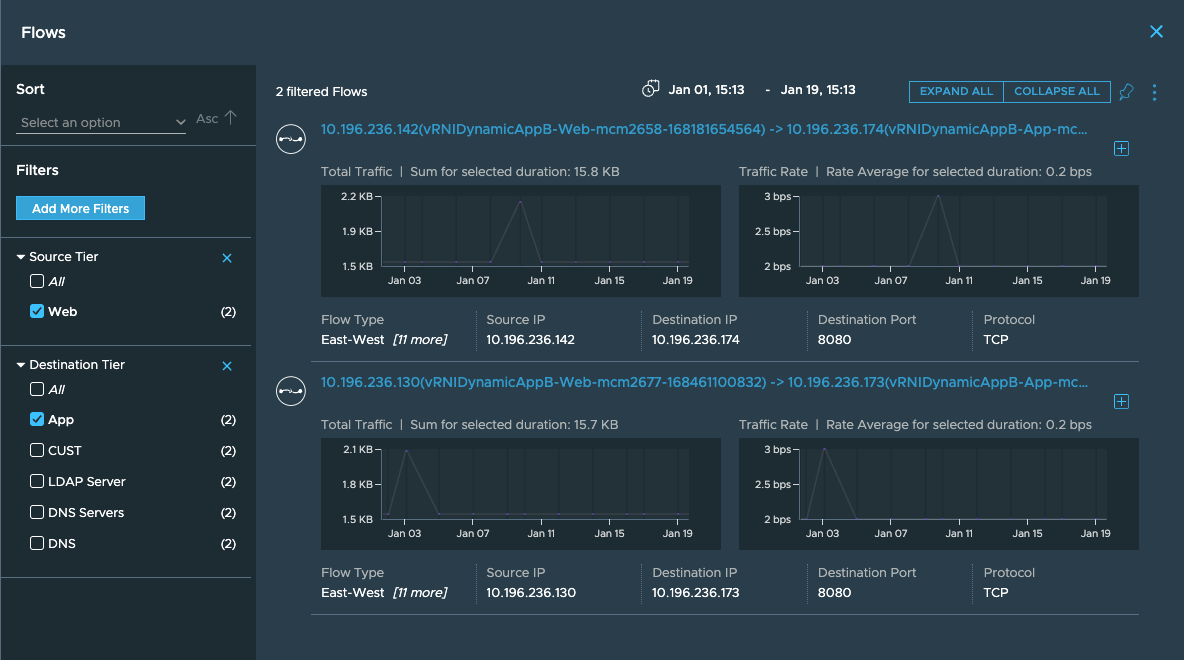
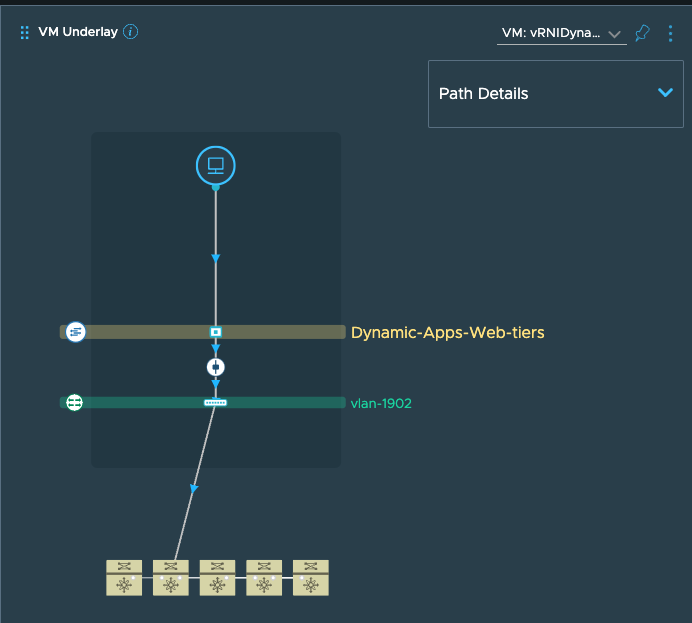
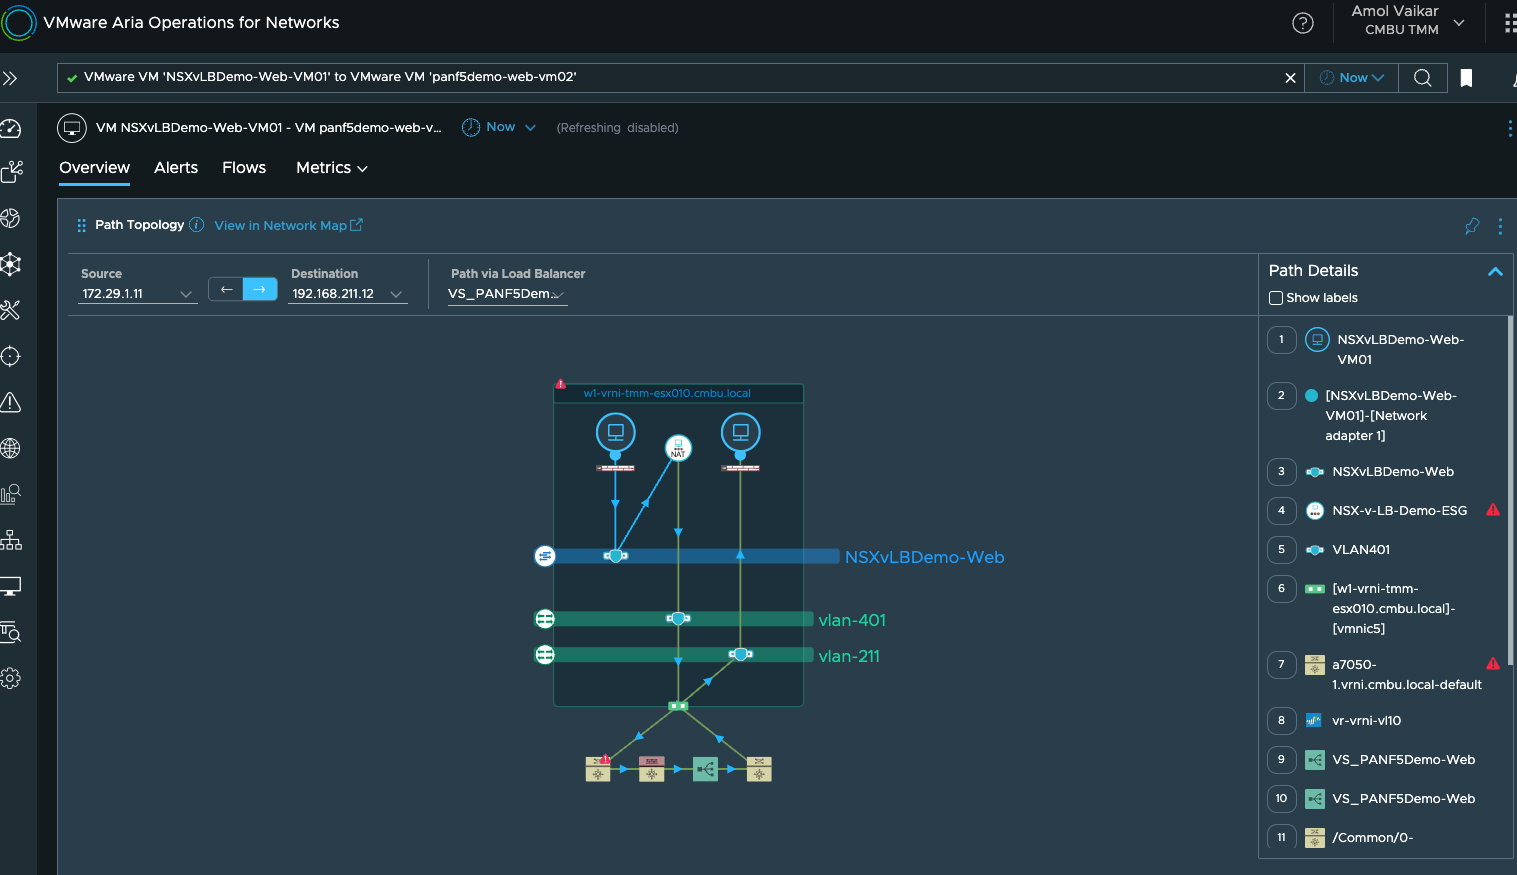
Once I click on this flow, it will show me the logical VM to VM path:
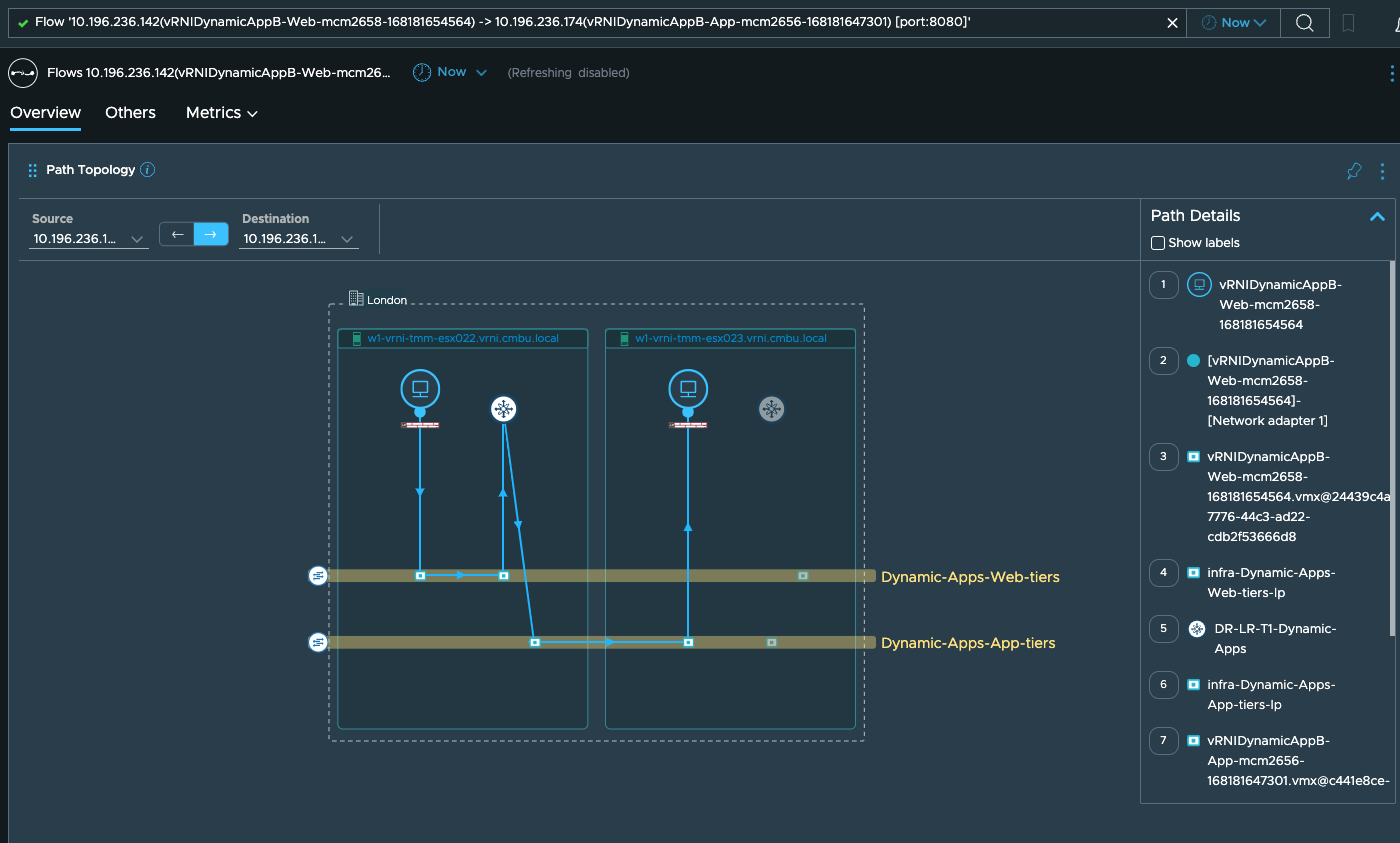
On this path dashboard, if you scroll down, you will also get to see the TORs to which these VMs are connected
To see the detailed physical path, I can go to the network map page and use the path search option:
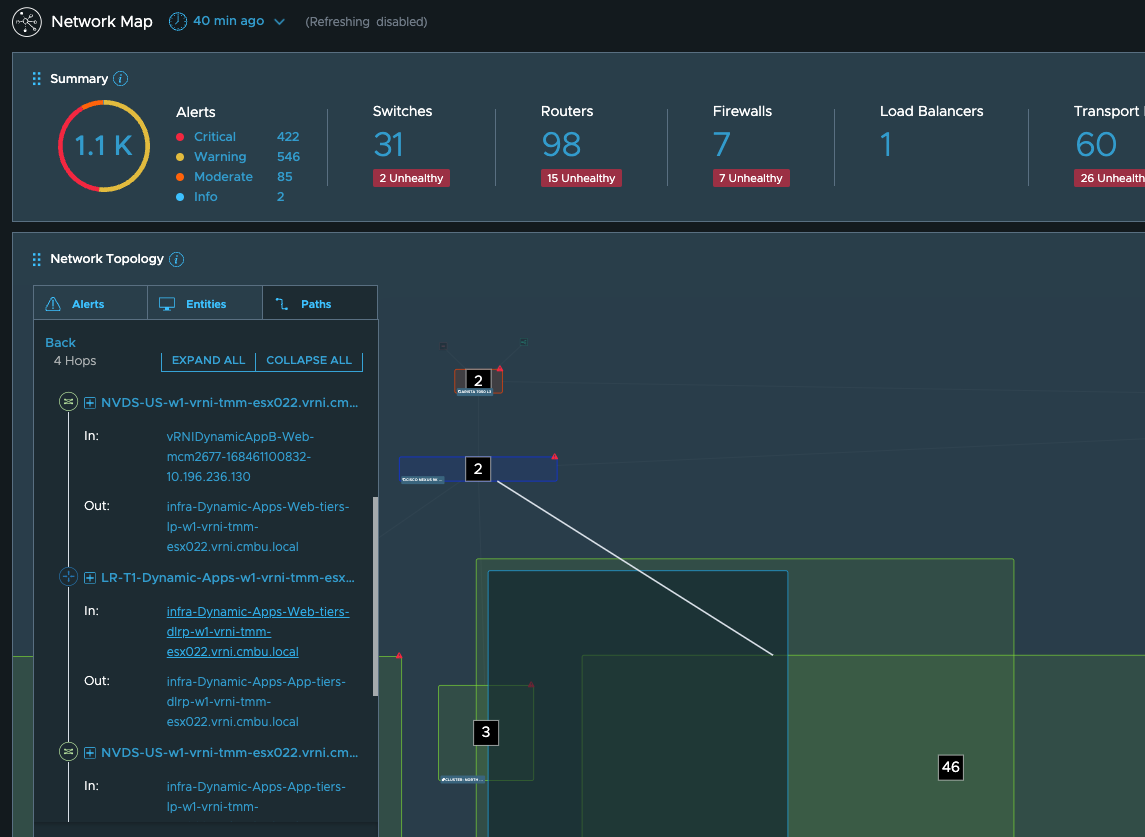
These paths should give you an idea of what components in the path need further investigation. To get a unified view of this along with the associated metrics and the anomalies, alerts etc. seen in this, you can start a troubleshooting session on the application:

You can continue to investigate the anomalies seen here and narrow down the root cause behind the performance issue seen your application.
This scenario should give you a good idea of how to use vRNI for investigating performance or connectivity issues in your environment.
We will go over a few other scenarios which help highlight the utility of vRNI is other ways.
Say Cisco releases a security patch for their router OS and so you need to patch the OS of all your Cisco Nexus Switches of 9K series, but you are worried about which VMs’s traffic could be impacted, and which of those VMs would be impacted the most. Since vRNI is adept at correlating the physical and virtual worlds’ configuration as well as metrics, you can simply write a query like this:
“vms where vnics.pathSwitchPorts.device.model like ‘n9k’ and vnics.pathSwitchPorts.device.vendor like ‘cisco’ order by Network Traffic Rate desc”
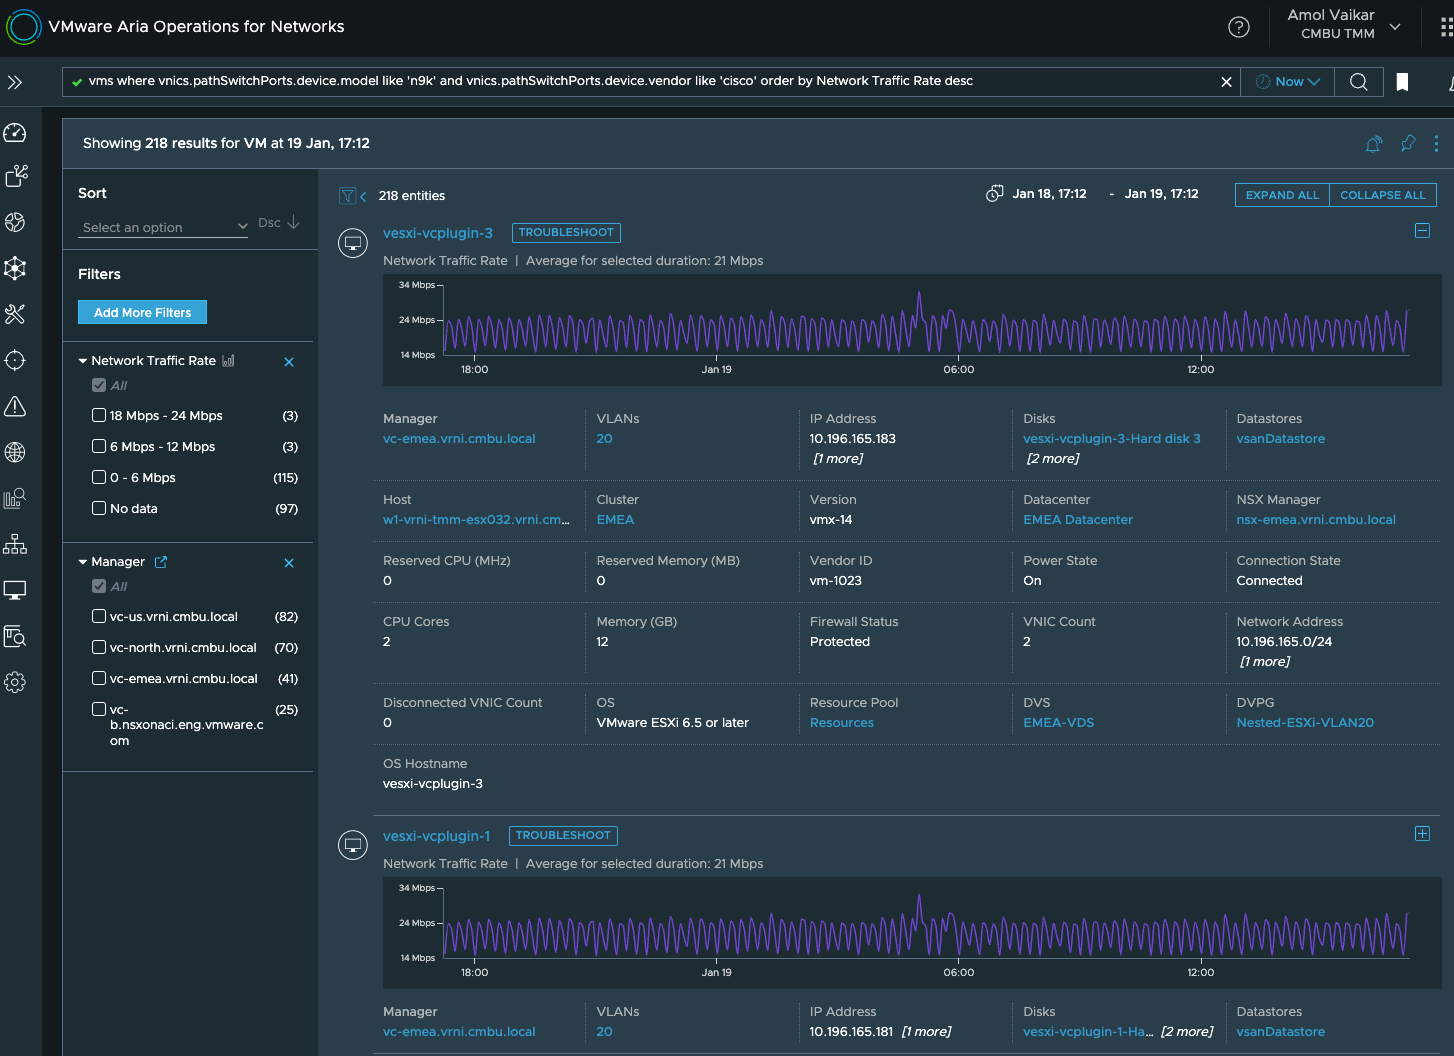
Once you have the list of the VMs that are likely to be most impacted, you can either notify the VM owners or the application owners of an impending down time or a VMotion time. If your org uses labels/tags to track ownership of the VMs, then selecting the ‘Tag’ or ‘Application’ properties from the filters in the above output will help. Alternatively, you can also use this query to find all the applications that a vm is a part of: “application of Tier where virtual member = ‘your vm name’” or if there are multiple VMs, you can use: “application of Tier where virtual member in (‘vm1 name’, ‘vm2 name’,…)”.
One very effective feature of vRNI is that vRNI maintains versions of the configuration that is captured from various sources. Which means that vRNI can “see” all the changes that are happening. These changes are available in the form of change alerts, and lot of usecases can be achieved using these since you can see these changes on the timeline of entities and also query vRNI for the changes that have happened to entities or their properties.
For instance, say there was an issue with your dhcp server/config owing to which you have noticed that some VMs have different IPs now as compared to what they had a few days ago, thus impacting the applications. So now you want to find if the IP address of any VM changed in the last 7 days so that you can proactively fix all those too in one go. In this case you can use a query like:“Ip Address Change in last 7 days”And get a list of all such impacted VMs that you need to recover.
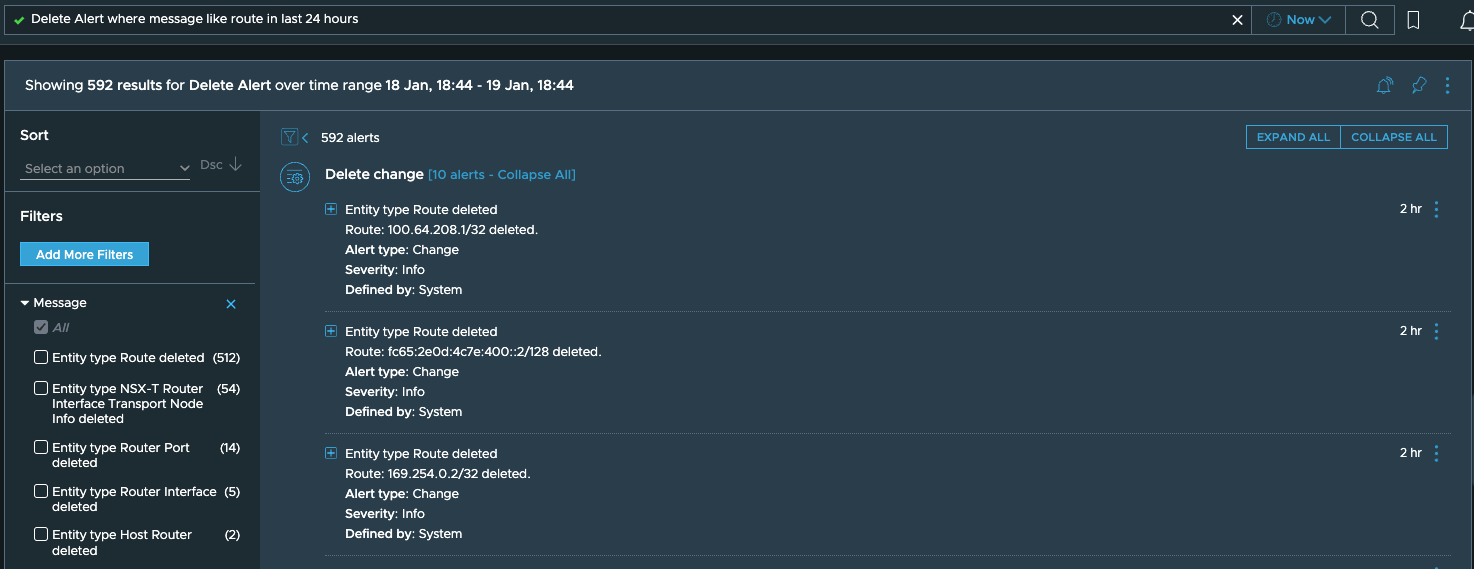
Let’s consider another scenario. Someone from your org opens a ticket saying that the payroll application is not reachable. You check the VMs associated with the application using vRNI or VCenter, and they are all healthy and running and there are no configuration changes associated with the VMs or their IPs. So now you are wondering if there are any changes to the network routes owing to which the VMs are not reachable, so you want to see if some routes have been deleted over the last day. This is when you run a query like:“Delete Alert where message like route in last 24 hours”
All these entities and their relationships is also why vRNI is able to provide detailed topology views across virtual as well as physical compute and networking elements, like some of the topologies shown here:
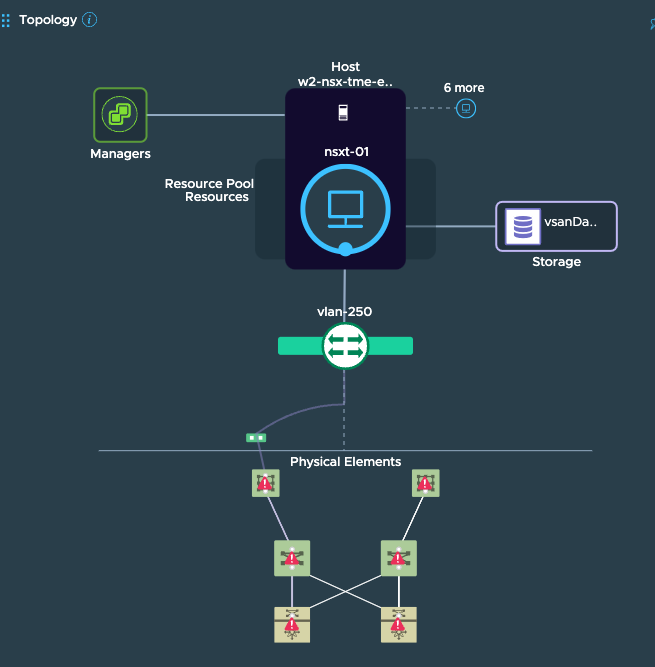
VM Topology:
Host Topology:
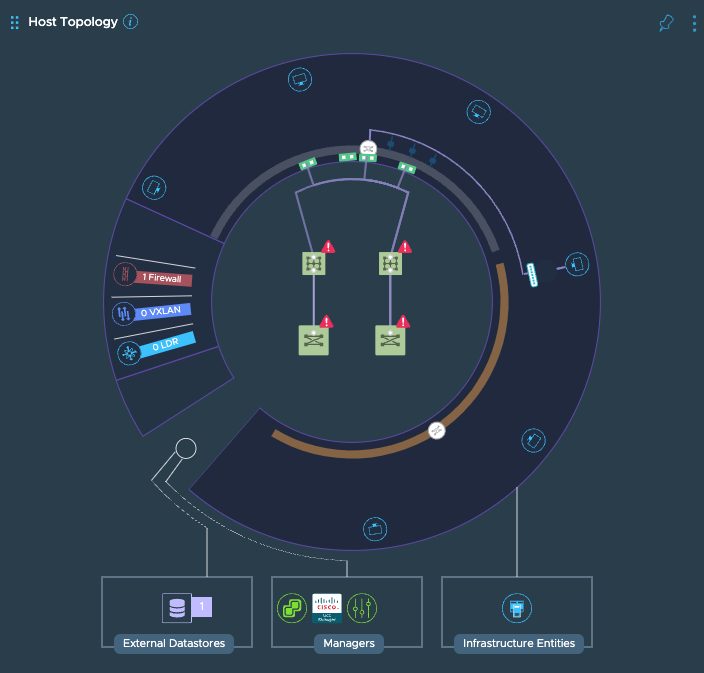
This visibility extends across firewalls, NAT, physical load balancers etc. too:
vRNI also collects netflow information and enriches it using configuration information, for instance, a typical flow 5 tuple is enriched with as many as 125 properties by vRNI which you can use for slicing-dicing the flow information, and 12 metrics which can be used for capacity, threshold, troubleshooting etc. related usecases. When you combine the flow information with the configuration information, you can achieve several cool usecases, samples of some of them are given here:
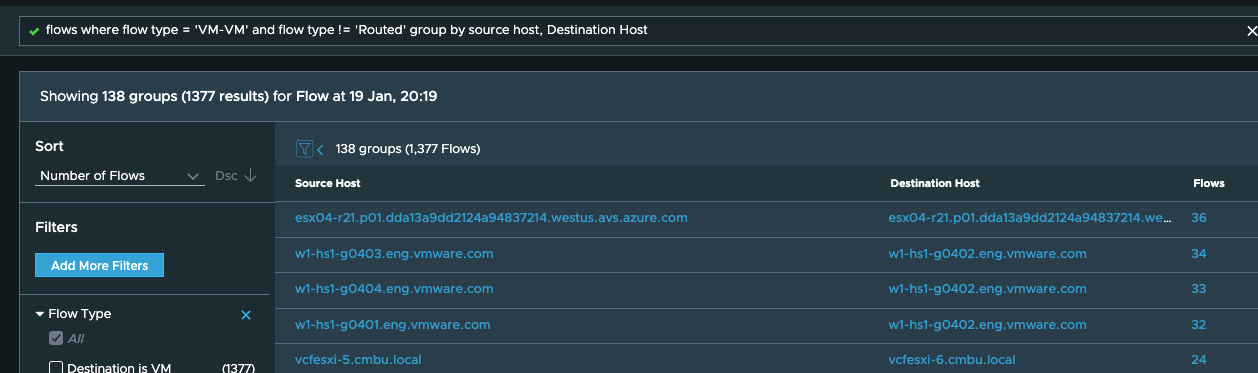
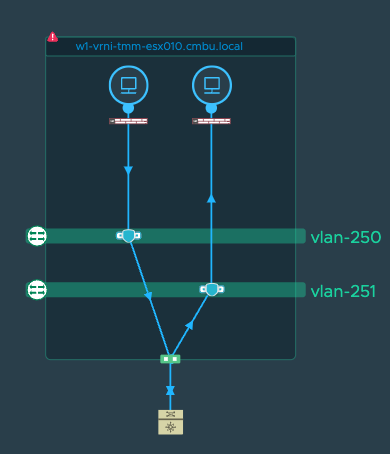
Say you want to find the traffic which is on the same L2 in the virtual network, but is actually jumping across ESX hosts in the physical world, so that you can optimize your network configuration for optimal switching? Just run a query like:
“flows where flow type = ’VM-VM’ and flow type != ‘Routed’ group by source host, Destination Host”
and from the output, pick the ones where the source host is not the same as the destination host:
On the other hand, if you want to find hairpin traffic so that you can
optimize the same or upsell NSX-T for its DLR capability, you just tweak
the above query like this:
“flows where flow type = ’VM-VM’ and flow type = ‘Routed’ group by
source host, Destination Host”
Once you get the search result, just pick the flows where source host
and destination host are the same and you can confirm them by viewing
the topology:
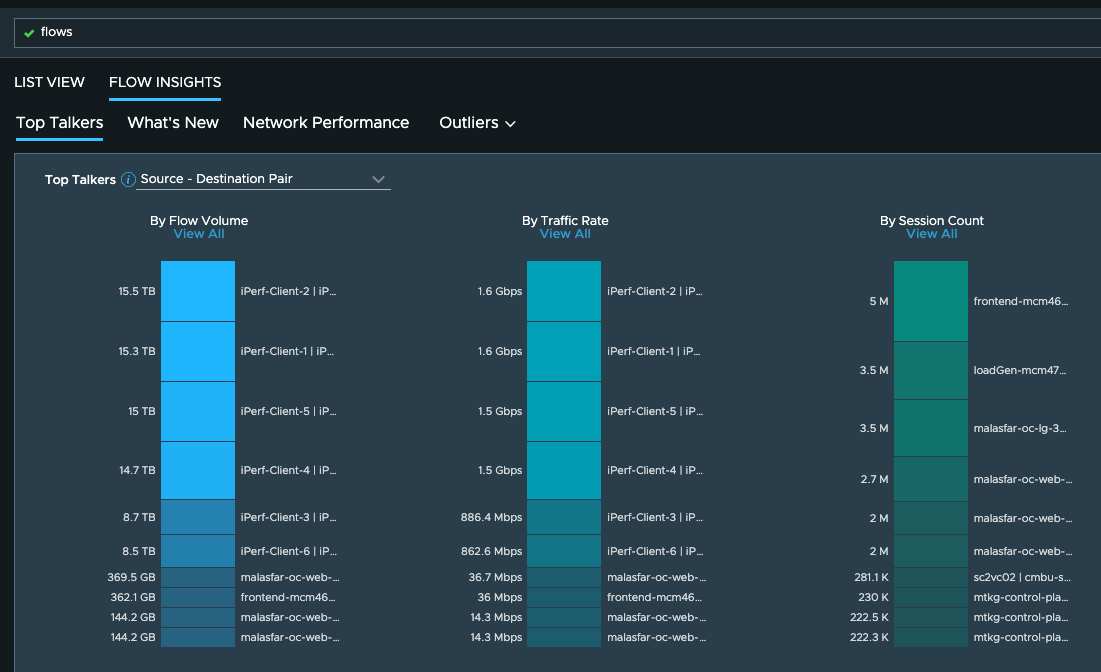
The flows information provides some excellent insights in the overall traffic patterns:
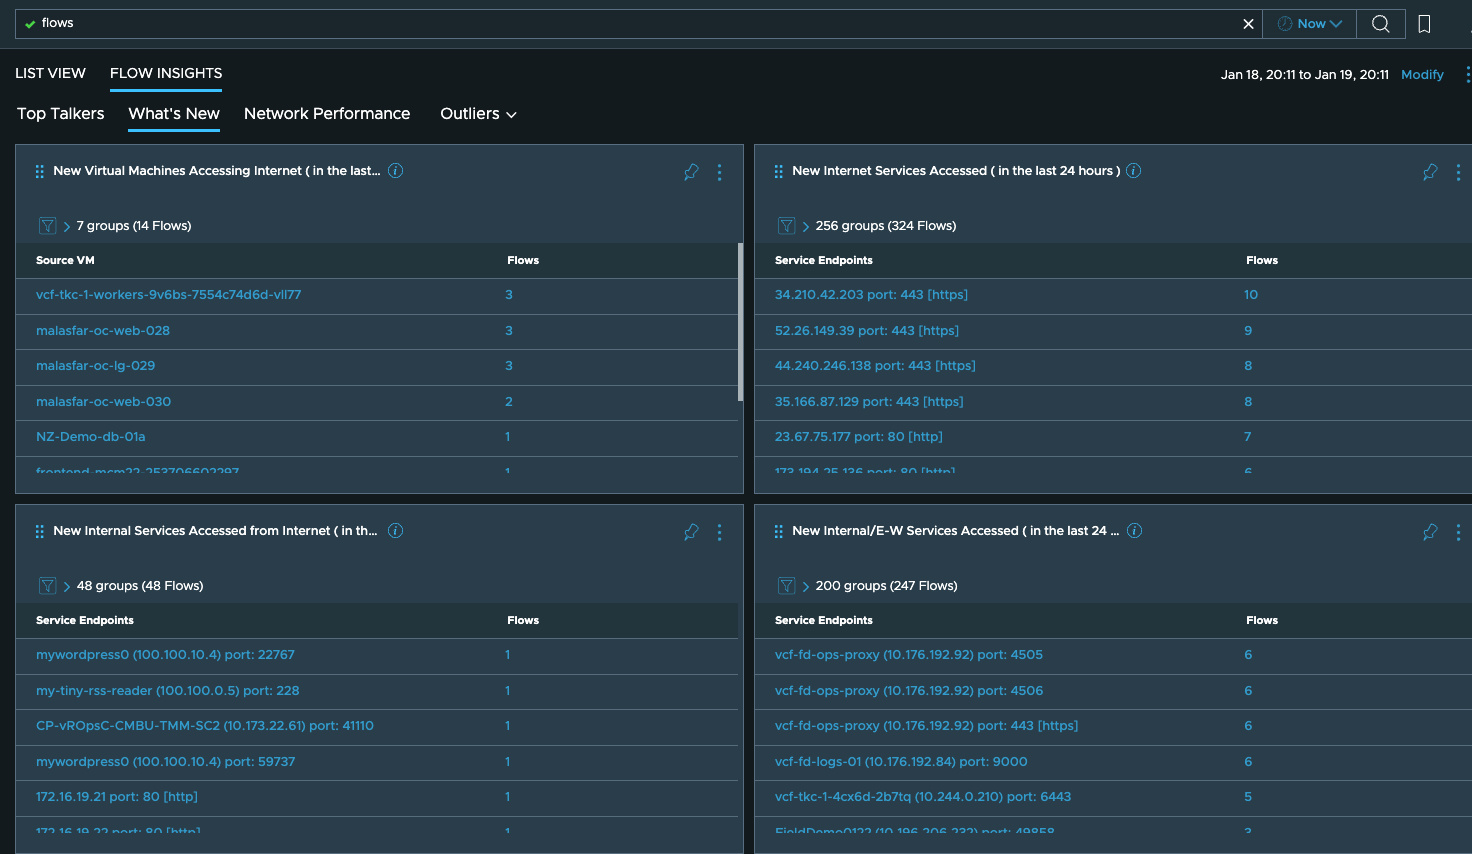
or any changes in the traffic patterns in the last 24 hours, which should help you in troubleshooting, security or capacity planning usecases:
For more usecases described in much more detail, please check out the other blogs on this portal