Latency Monitoring using vRNI
If you are reading this blog, it’s highly likely that you already know what network latency is and the impact that high latencies can have on your applications and business.
So, here we are going to discuss how you can use vRNI to gain visibility into the latency, get notified when things are about to get nasty and figure out what is contributing to the high latencies.
What metrics does vRNI capture that can help in latency monitoring?
The obvious ones, these are the metrics that are explicitly and obviously about latency:
-
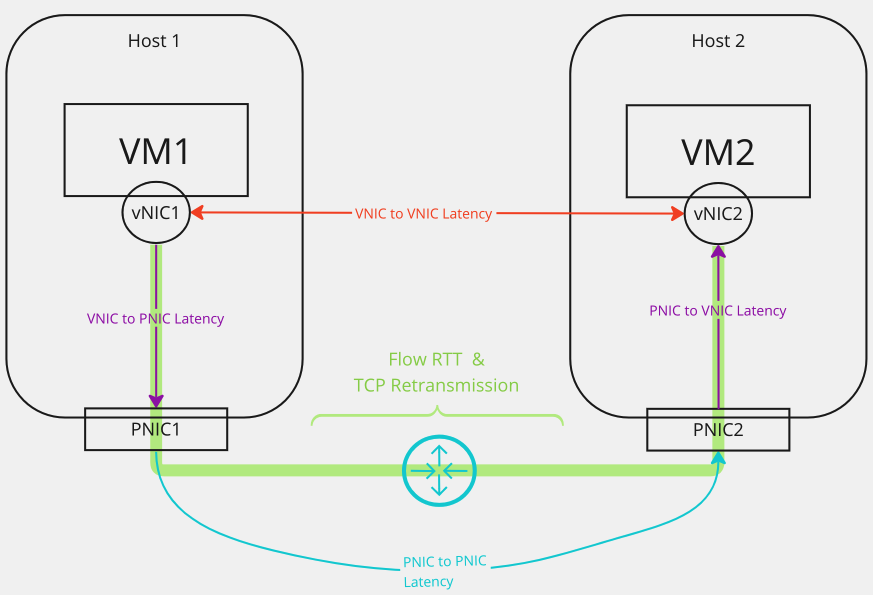
**vNIC to vNIC latency**
It is the time taken by the packet to travel from the source VM’s vNIC to the destination VM’s vNIC on the same ESXi host or across ESXi hosts. -
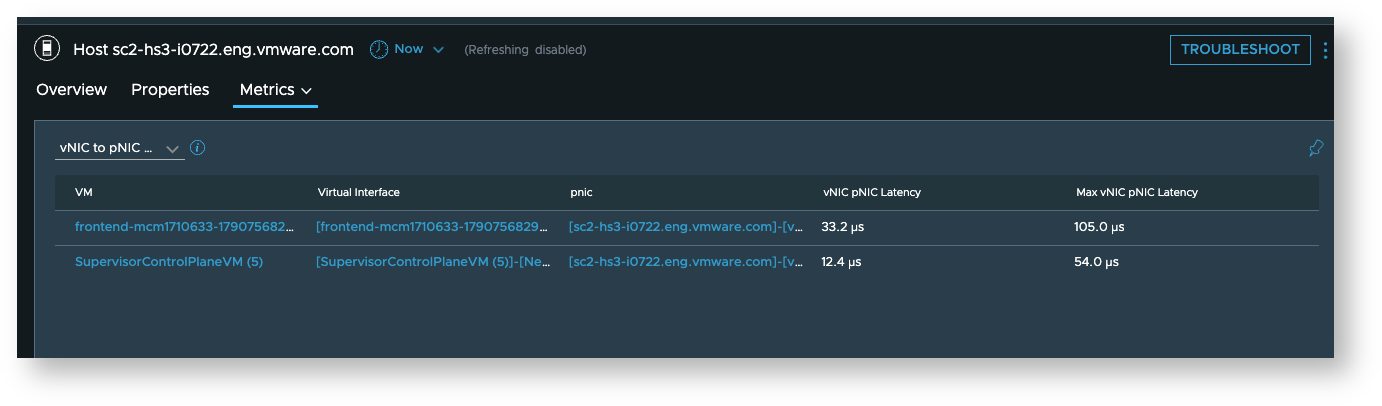
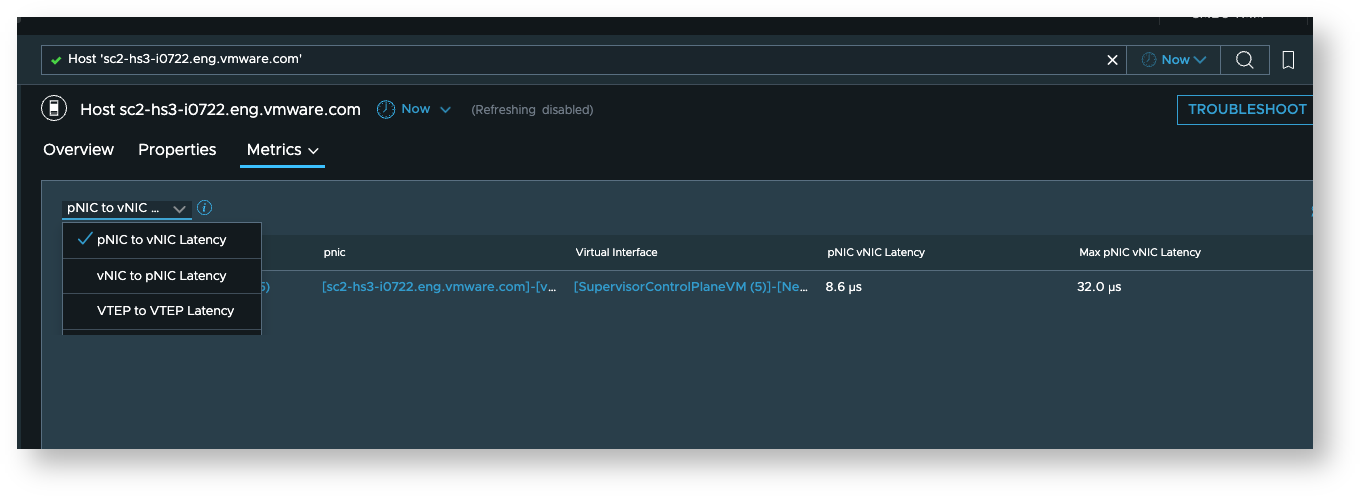
**vNIC to PNIC & PNIC to vNIC latency**
It is the time taken by the packet to travel from the source VM’s vNIC to the PNIC of the host transport node of the source VM -
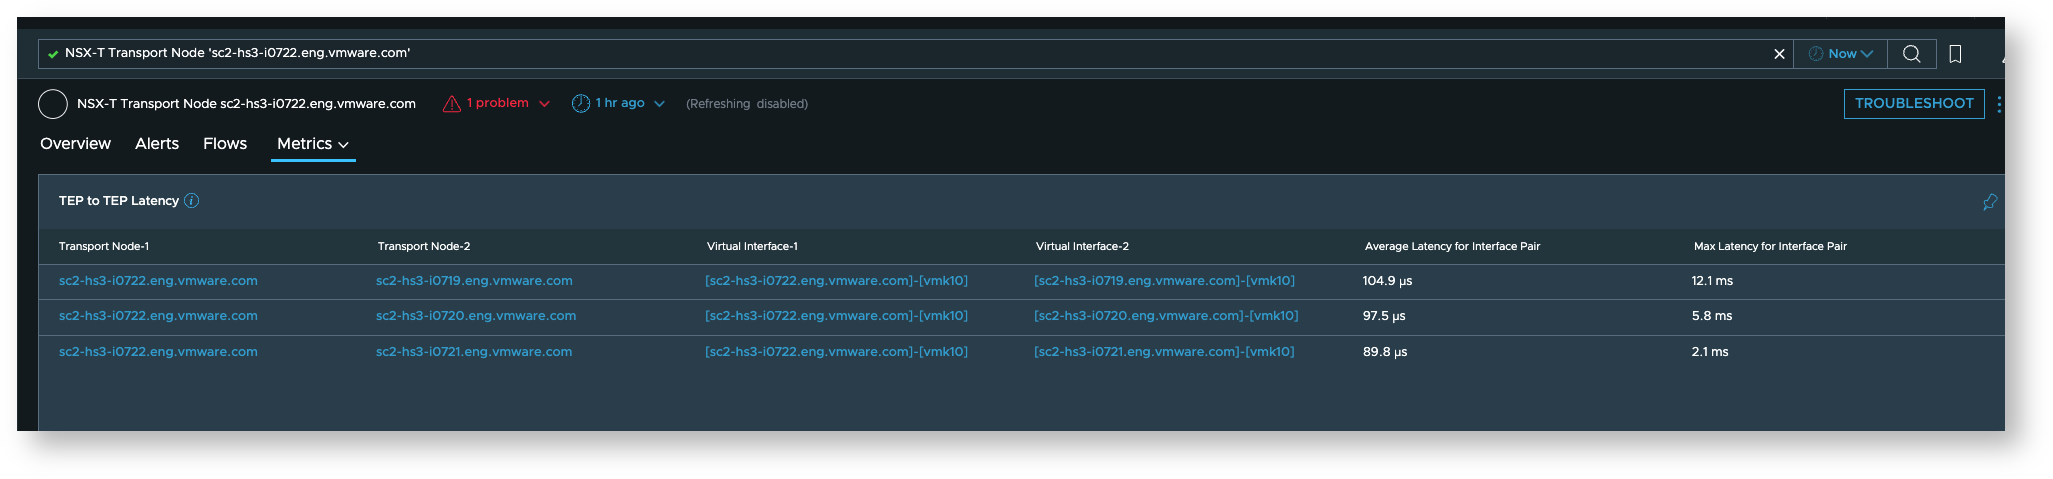
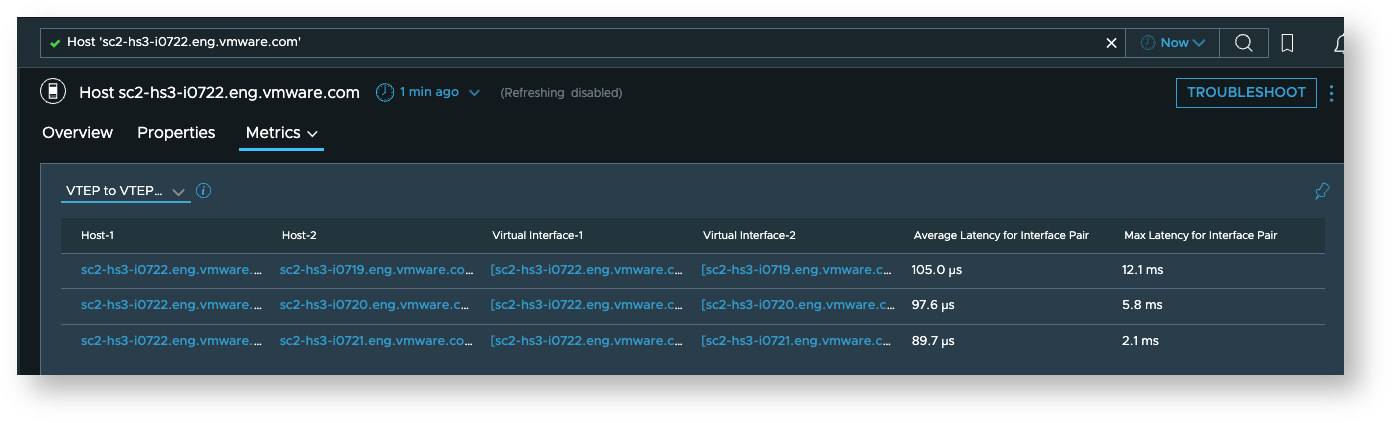
**PNIC to PNIC latency (a.k.a. VTEP to VTEP latency)**
It is the time taken by the packet to travel from the PNIC/VTEP of the host of the source VM to the PNIC/VTEP of the host of the destination VM over the underlay network connecting the two hosts. -
**TCP RTT & Retransmission counts for IPFIX Flows**
NSX-T DFW IPFIX flow records include additional information about the TCP Round Trip time for establishing the flow and the TCP packet retransmission count to compensate for the high RTT or drops. These are in the form ofretransmissionCountandaverageLatencyfields associated with the flow between a pair of IP addresses. vRNI enriches the flow information with VM, Hosts, Applications, E-W/N-S nature of traffic etc. and aggregates them and presents the max and average values for these metrics in association with the flows.
Not so obvious ones, which can nevertheless contribute to the latency and network performance that impact an application
- Total Network Traffic per host
- Network Packet Drop % per host
- CPU Usage Rate per host
- Maximum CPU Wait Rate of VMware VM per host
- Maximum CPU Ready Rate of VMware VM per host
Where are these metrics available in vRNI?
-
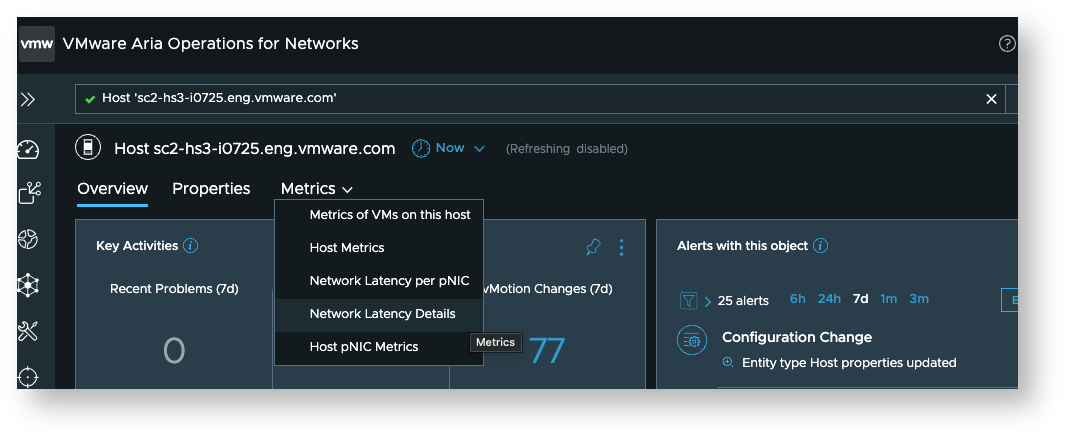
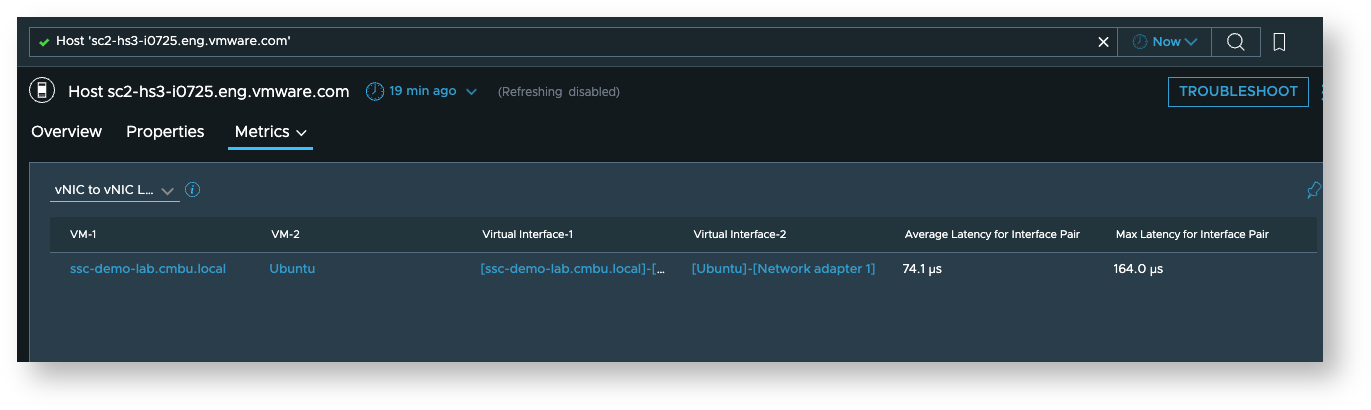
vNIC to vNIC latency metrics
These are available on the host dashboard in the “Network Latency Details” section of the “Metrics” tab.
-
vNIC to PNIC, PNIC to vNIC latency metrics
These are available on the host dashboard in the “Network Latency Details” section of the “Metrics” tab.
-
PNIC to PNIC latency (VTEP to VTEP latency)
PNIC to PNIC latency is relevant for latency between ESX hosts. You can find it on Host Transport Node dashboard as well as ESX Host Dashboard
-
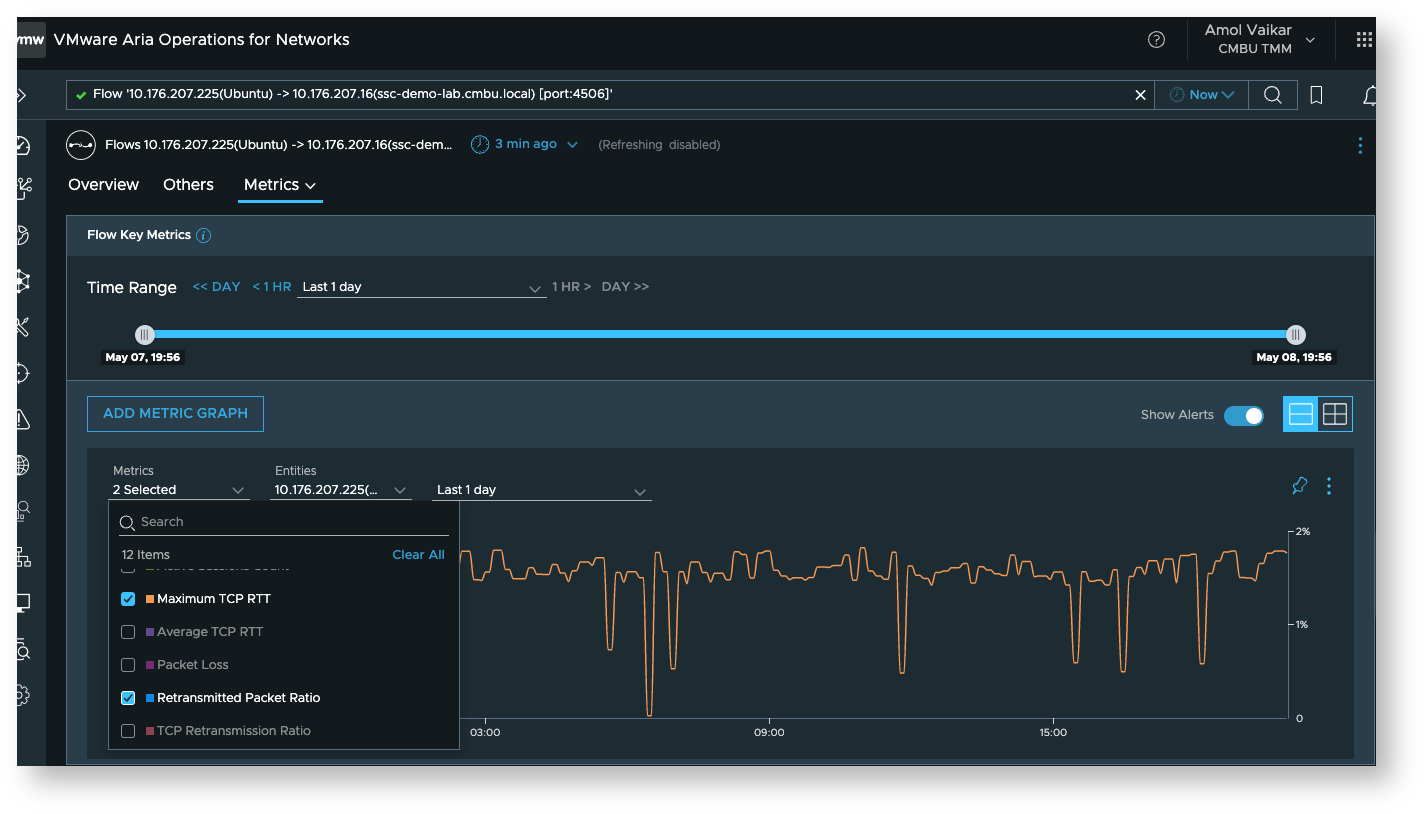
Flow Metrics
You can view the flow metrics for individual flows, or group of flows filtered using various flow properties or metrics associated with flows.-
For instance, here we see the metrics for a specific flow
-
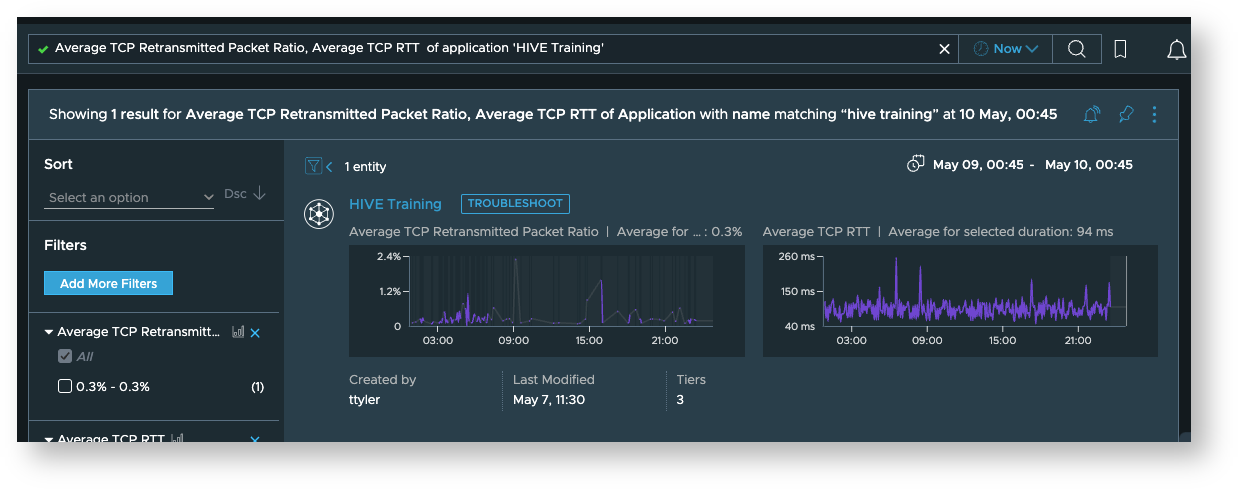
While here, we query those metrics for a specific application named ‘Hive Training’
-
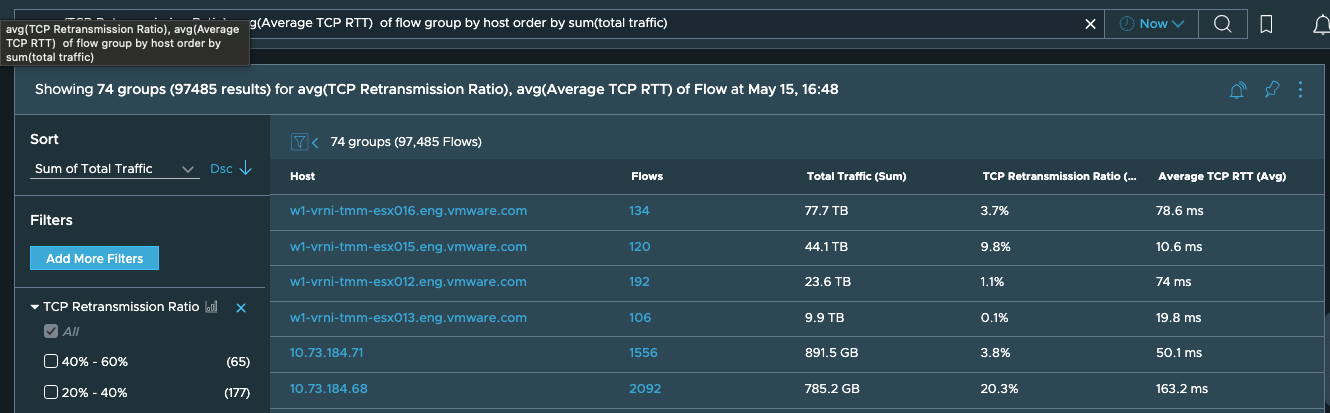
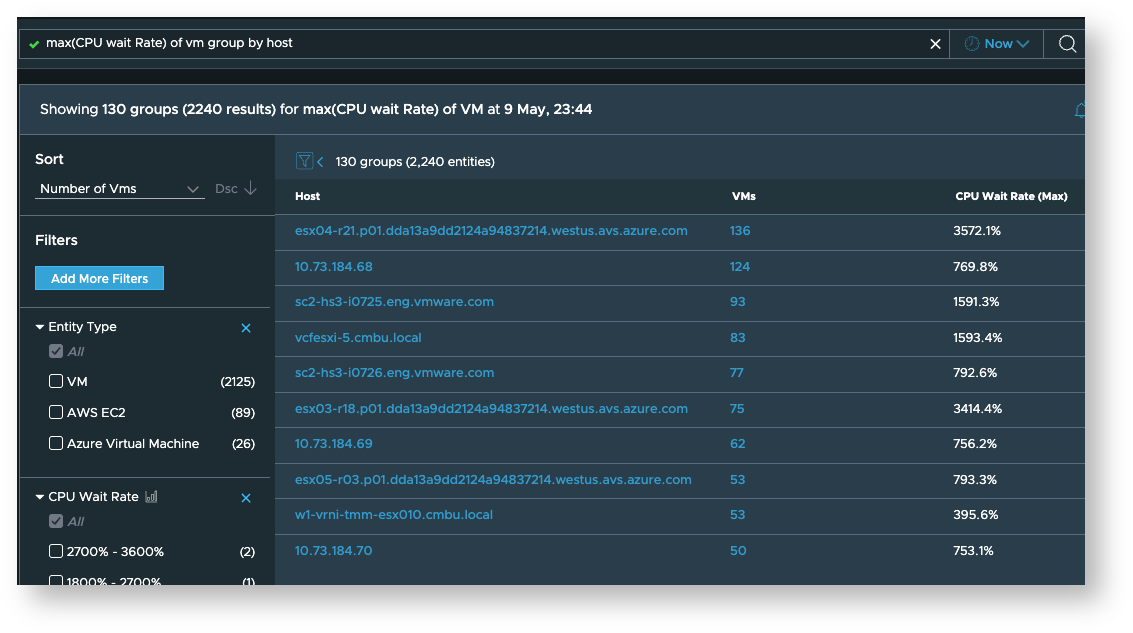
If we want to identify the Host with High TCP RTT / TCP Retransmission Ratio, we can use the following query.
avg(TCP Retransmission Ratio), avg(Average TCP RTT) of flow group by host order by sum(total traffic)This will help us identify the Host having high traffic and high TCP RTT/Retransmission Ratio.
-
-
Other metrics
-
Relevant Host metrics
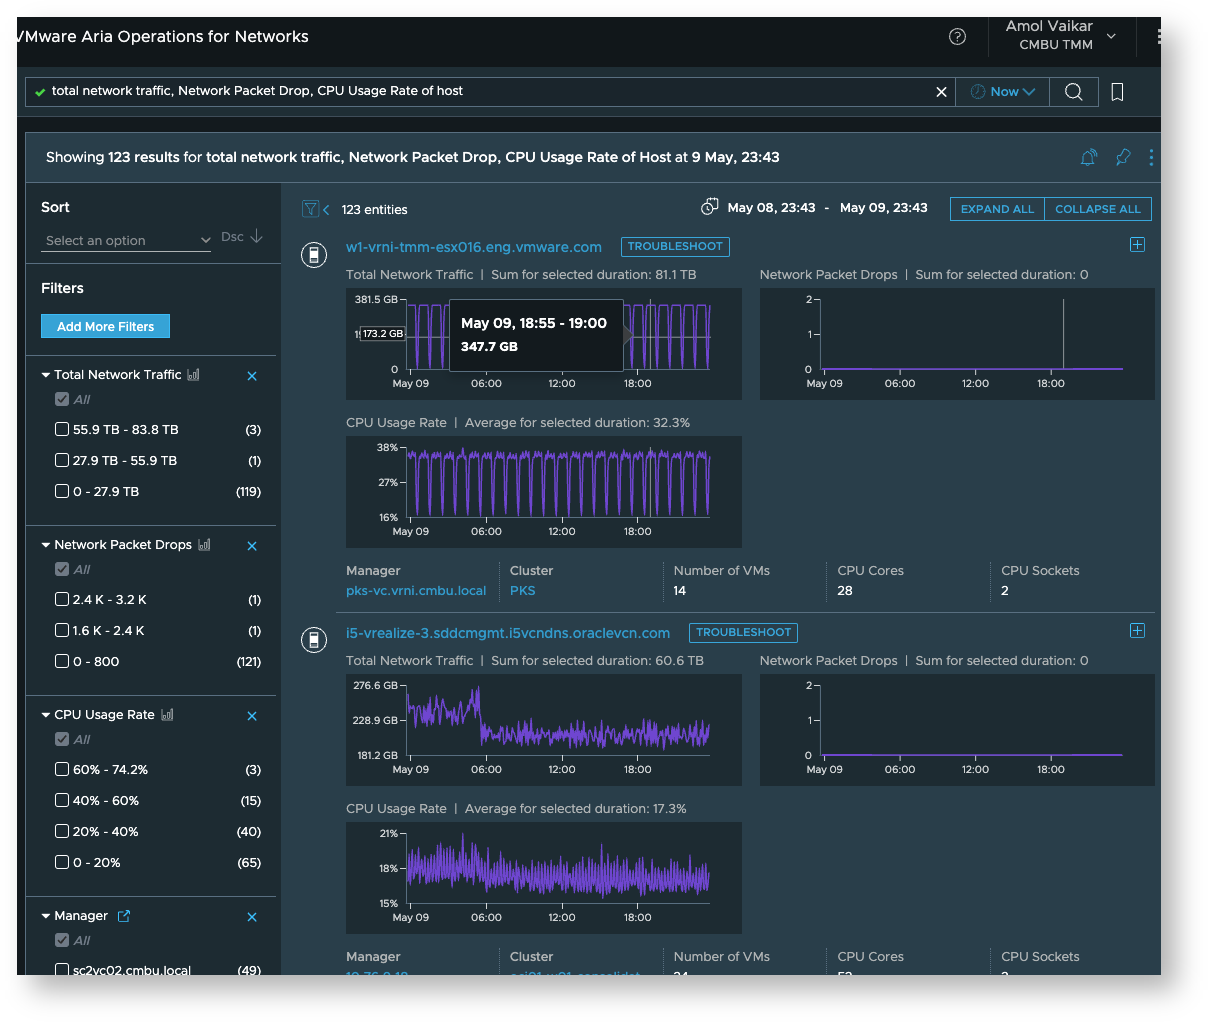
-
VM metrics per host
-
Monitoring using these metrics
-
You can create custom dashboards or pinboards for the latency, flow RTT and other metrics listed above.
-
You can create threshold analytics so as to get an alert when these metrics cross certain thresholds
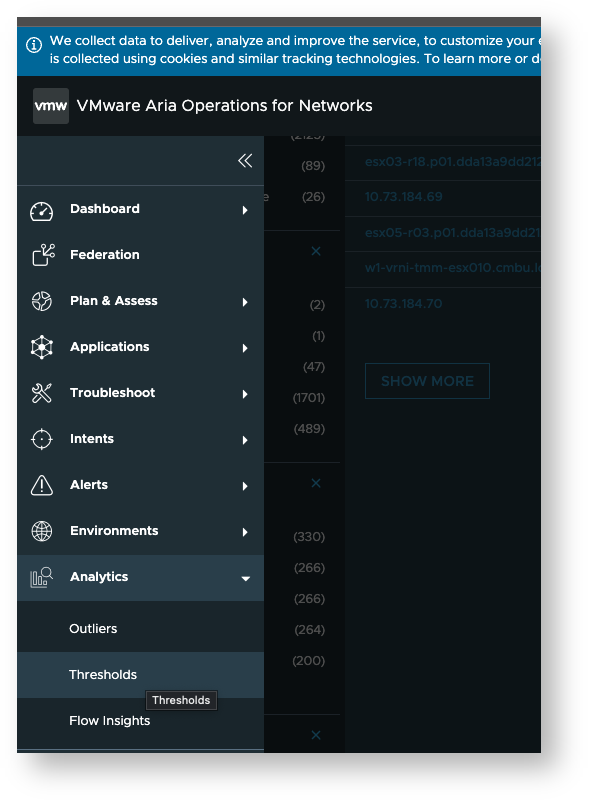
-
As an example, say you want the communication to your database servers to have latencies < 3 MS and you’d like to be alerted if that requirement is violated. For such a scenario, you could create a threshold analytics configuration as shown here:
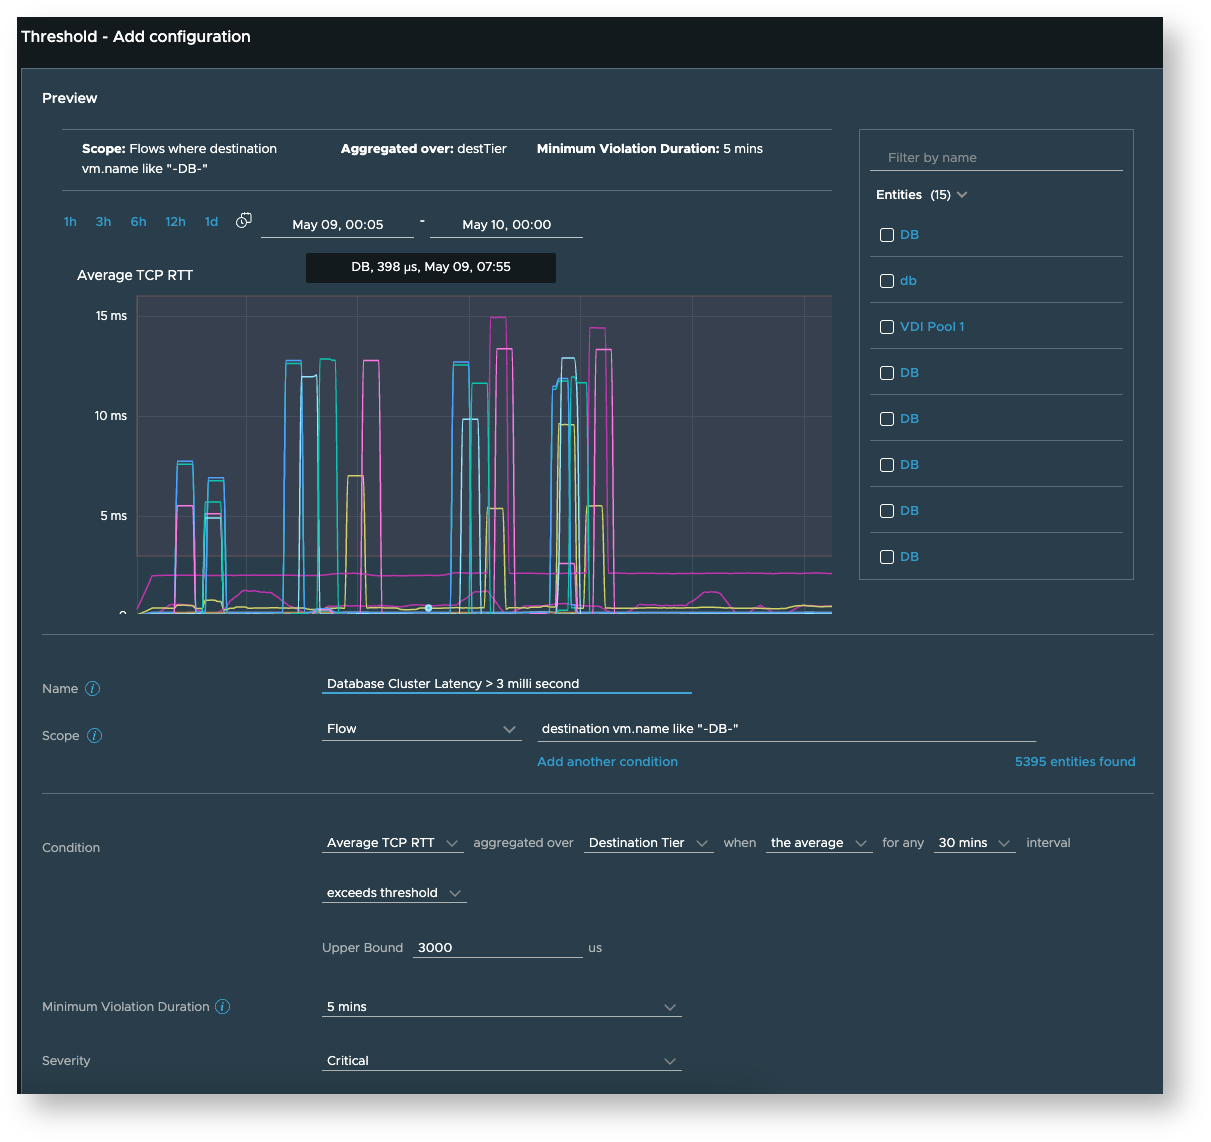
-
As another example, say you want to be alerted when the packet drop ratio of certain important VMs like your edge transport node VMs or virtual load balancers etc. crosses a particular threshold, you could create a configuration as seen here:
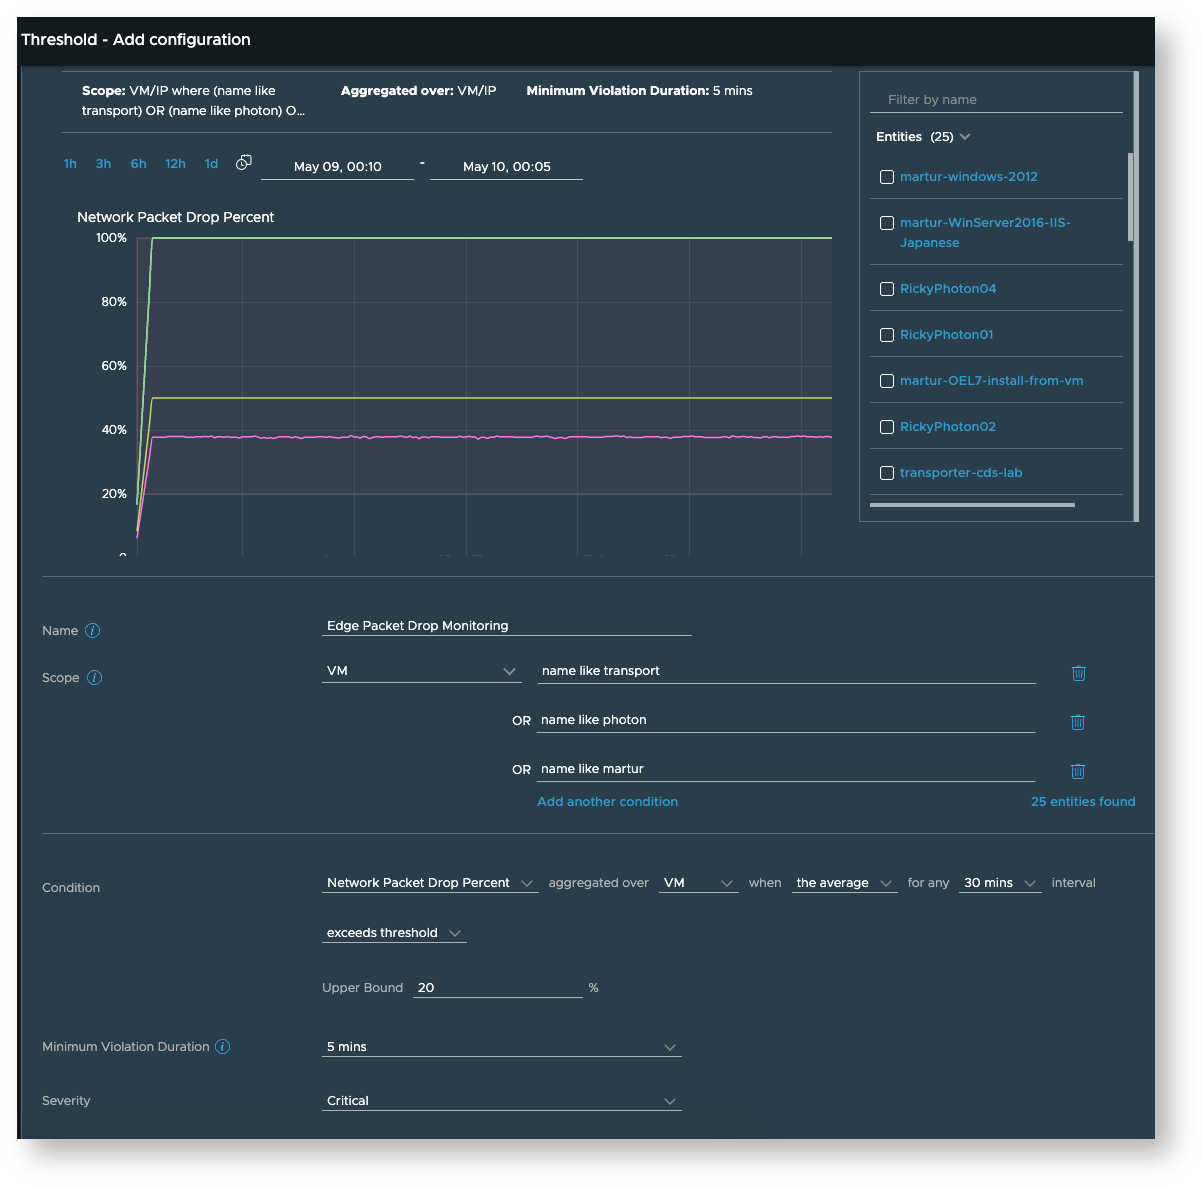
-
-
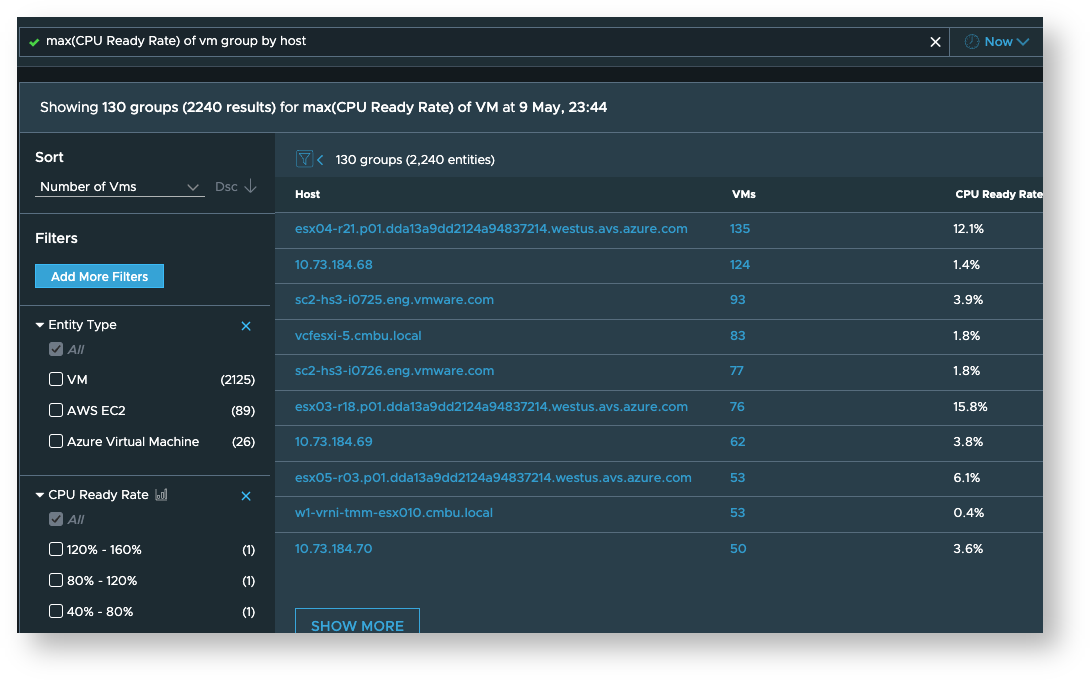
For the metrics which are not (yet) supported in threshold analytics, you can use Search Based Alerts, you can read more about them here. But, as an example, we know that CPU ready rate can be a good indicator of capacity issues getting masked as performance issues. And this metric is currently (as of vRNI 6.10) not supported in threshold analytics. So you can use search based alerts to get notified if the CPU ready rate reaches a value you are not comfortable with.
-
You can use a query like “vm where CPU ready rate is > 120%” to see which VMs violate your rule at this time
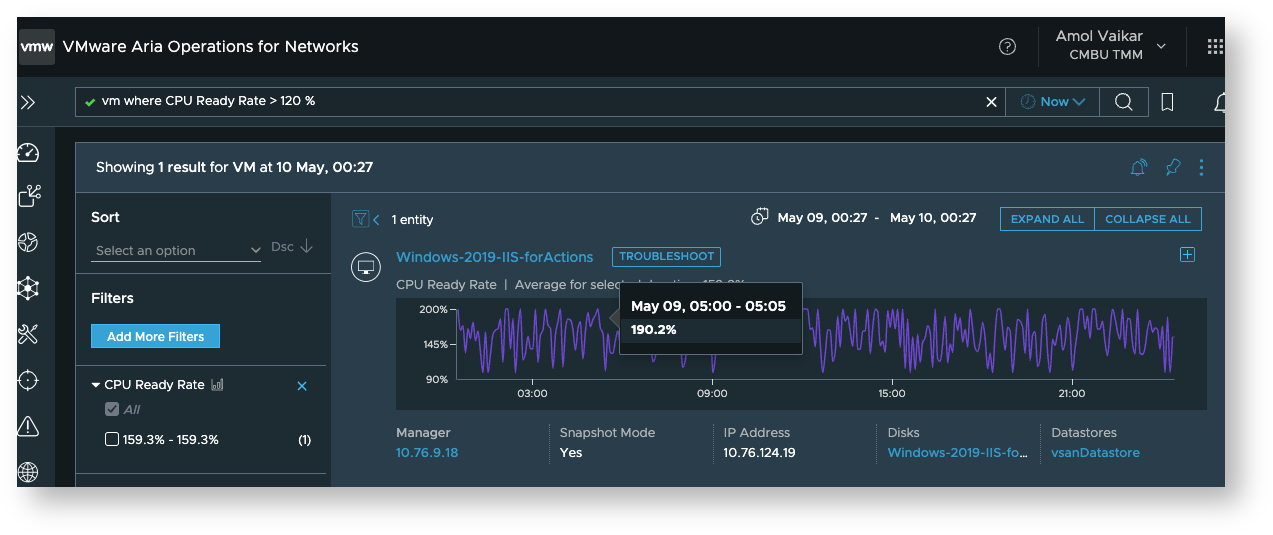
-
And for future alerts, you can click on the bell icon next to the pin icon to create a search based alert using the “Search results change” rule:
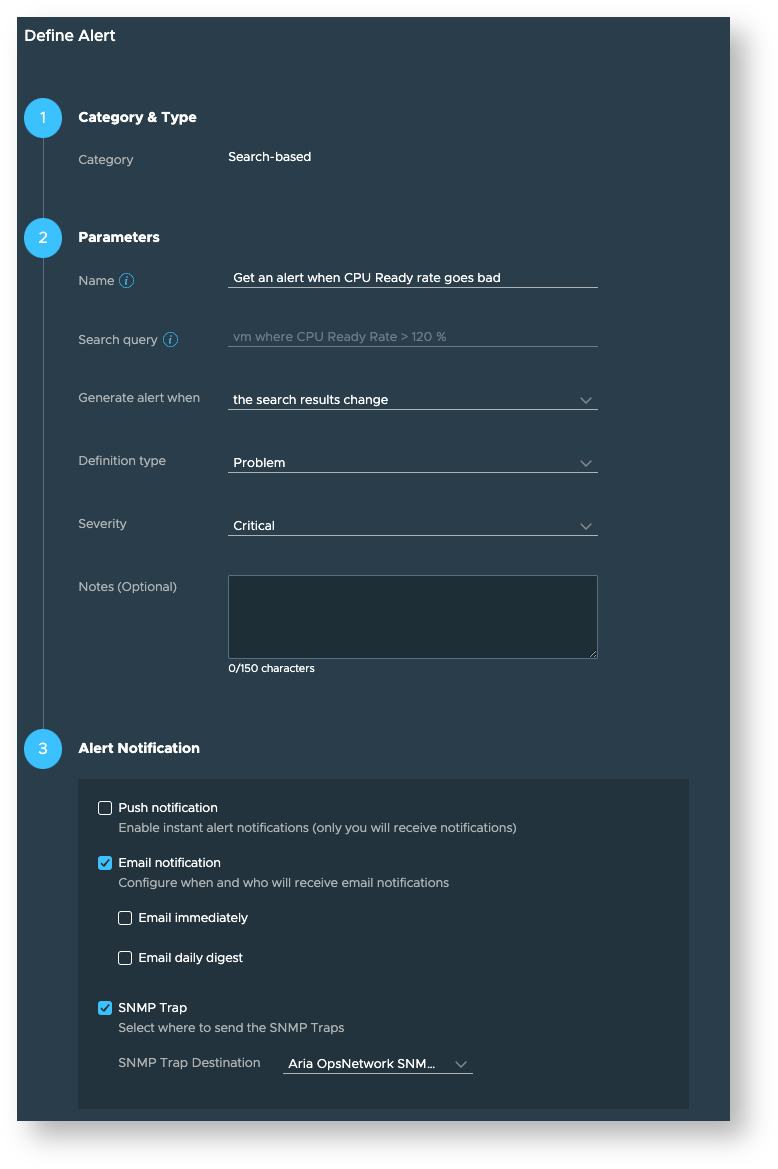
-
These approaches should help you keep tabs on the latency and various other relevant metrics that impact your application performance.
In a later blog, we will discuss how to use vRNI to find the root cause of the network latency so that you can resolve the problem.