Mr. Monk and the blast radius of alerts
Spoiler alert:
What connects a brush fire around a camping ground in wilderness, death of a basketball coach by accidental electrocution 4 weeks after the fire, and a vicious murder of a young victim on a golf course 50 miles away a few years before the brush fire happened?
It takes the ingenuity and skills of the silver screen’s famous detective, Mr. Monk to be able to trace the connecting dots between the seemingly unrelated incidents in order to solve the mystery and get to the culprit.
It is not everyone’s cup of tea to be able to deduce correlations
between incidents which dont seem to have any influence on each other,
and as Mr Monk himself says,

One would think such far reaching mysteries happen only in fiction and not in any datacenter, but that couldn’t be further from truth. And unfortunately, you can’t practically have a Mr. Monk working in every datacenter.
A malfunctioning switch port or a rebooting switch can have far reaching repercussions on performance or availability of applications or services which have direct impact on the customers and the business.
But fortunately for the admins, Aria Operations for Networks (vRNI) makes it much easier to connect the dots and figure out the extent of direct/indirect damage caused by major or minor issues in the infrastructure.
Lets consider this scenario:
You see an open alert in AON which indicates that there is a misconfiguration of a port on the physical router:
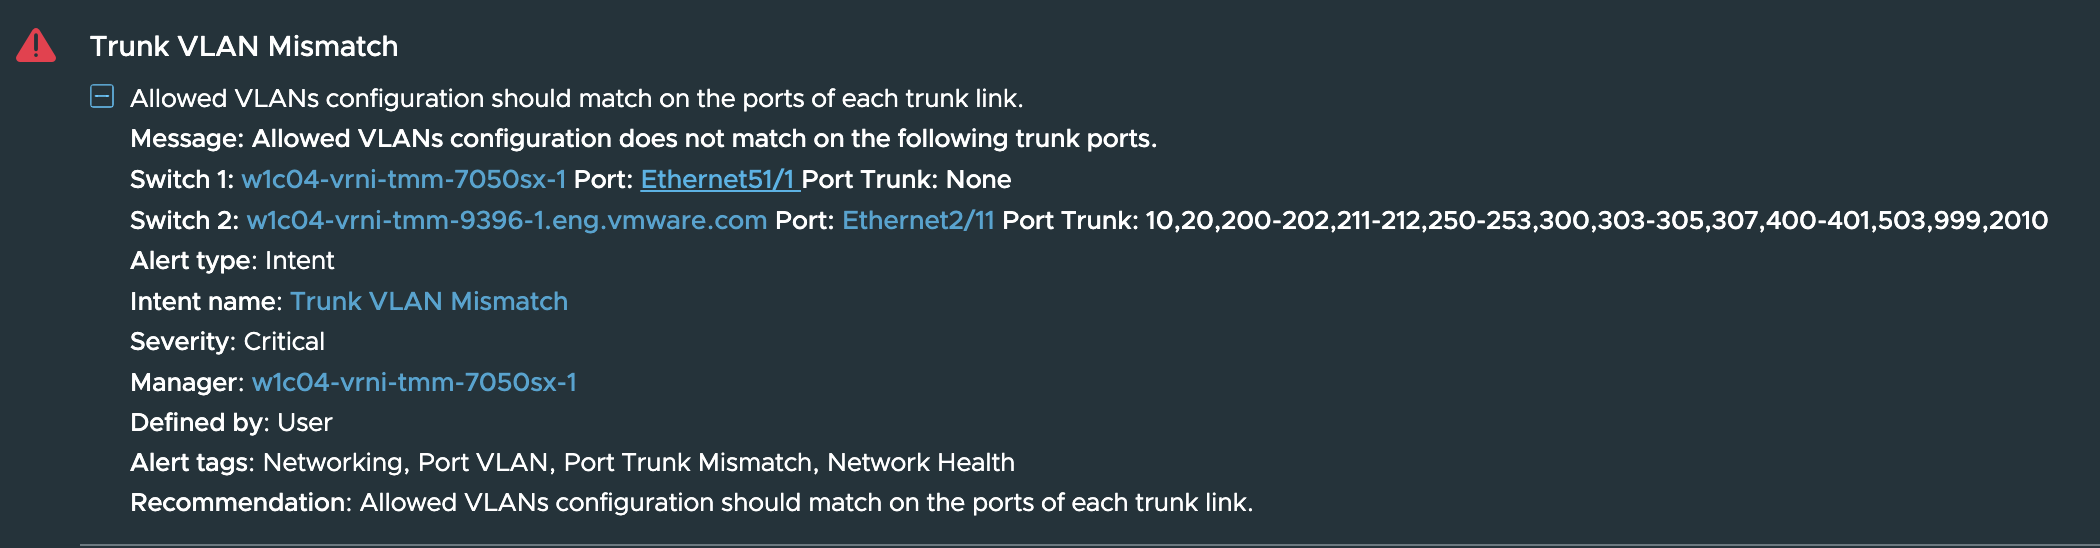
While you will obviously fix this issue once you have an approval, you want to find out which applications could be getting impacted owing to this issue.
In this case, this is what you can do:
-
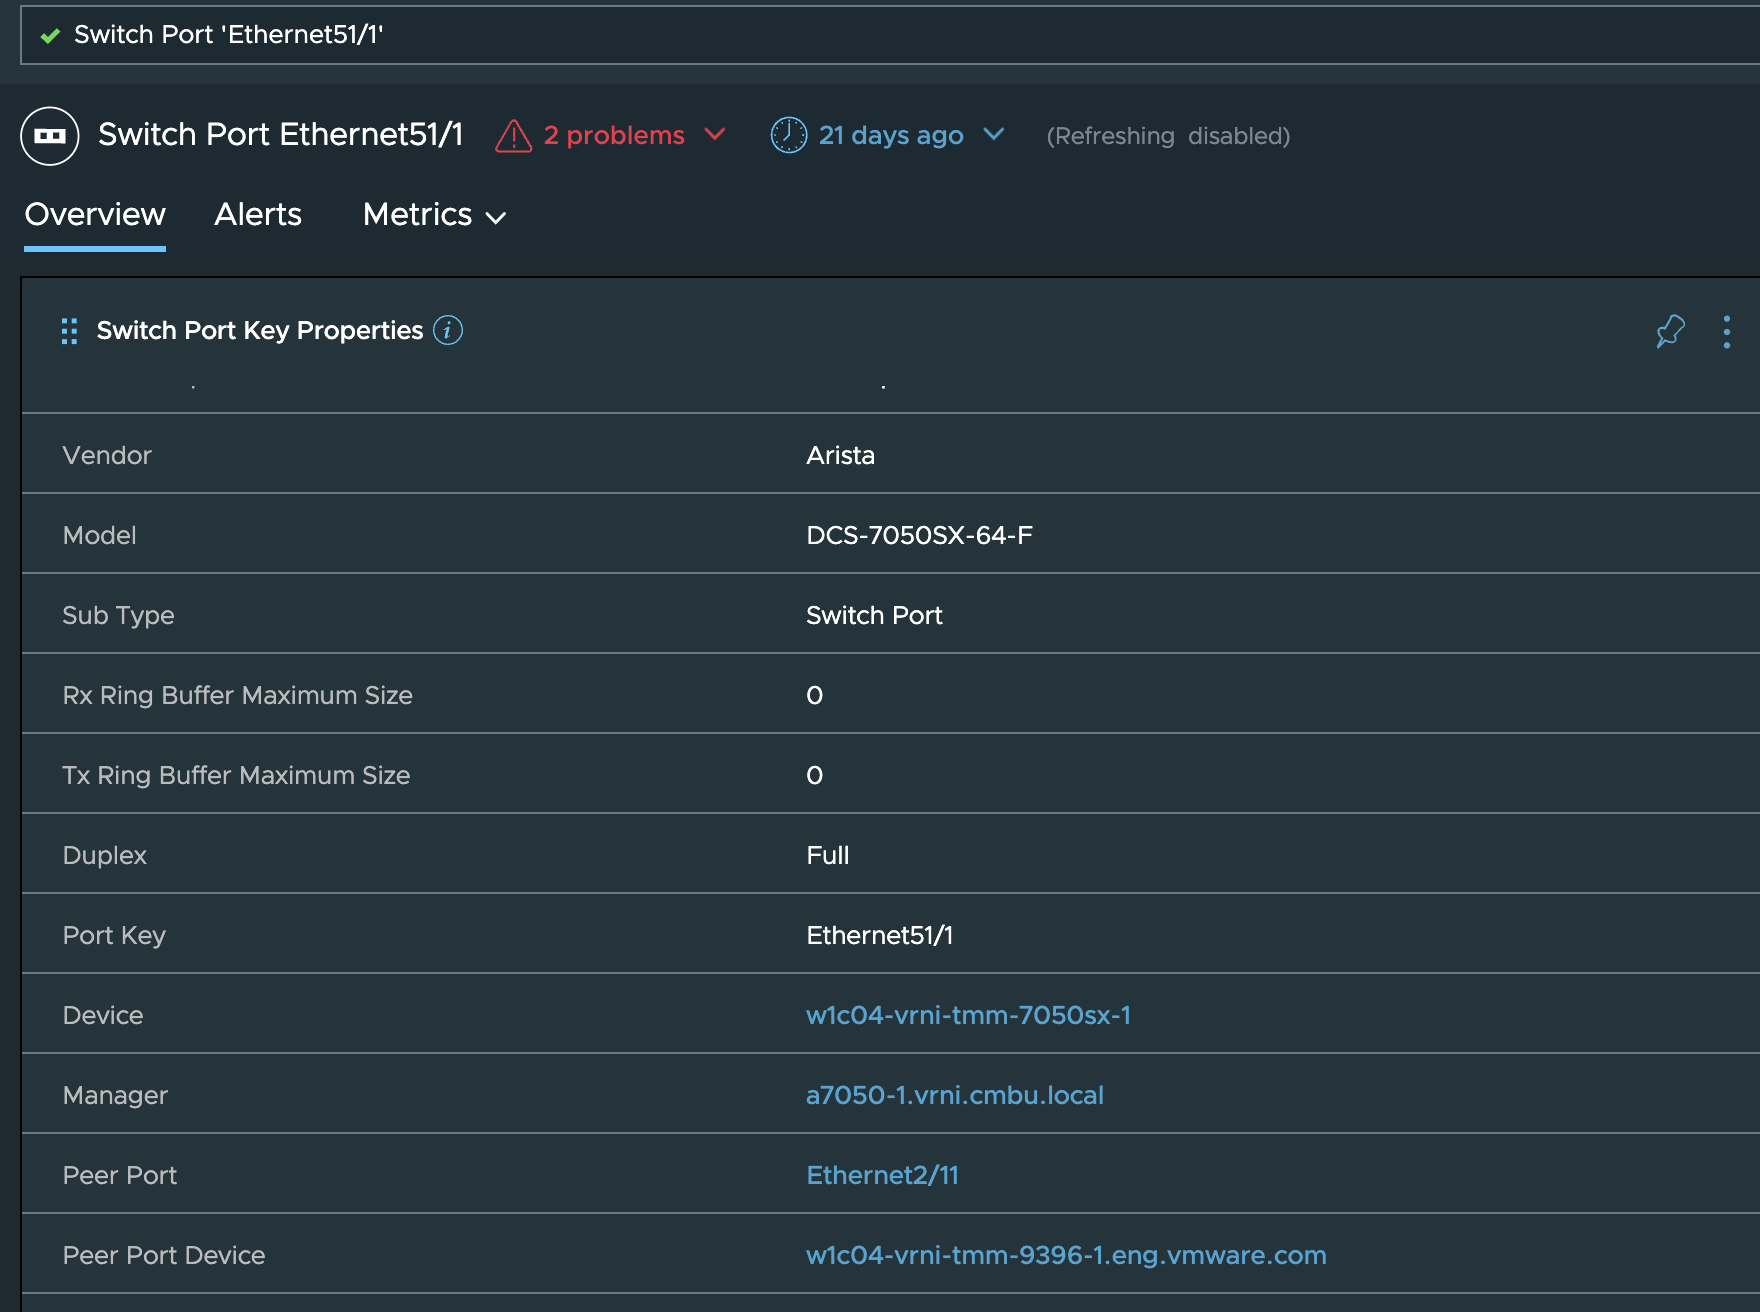
From the above alert, you click on the port which seems to have the wrong configuration, viz. Ethernet51/1, which will show you the details of the device this port is connected to (assuming that too is added as a datasource to vRNI):
-
For instance, this port Ethernet51/1 is connected to port Ethernet2/11 of switch w1c04… so next we check the dashboard of this device:
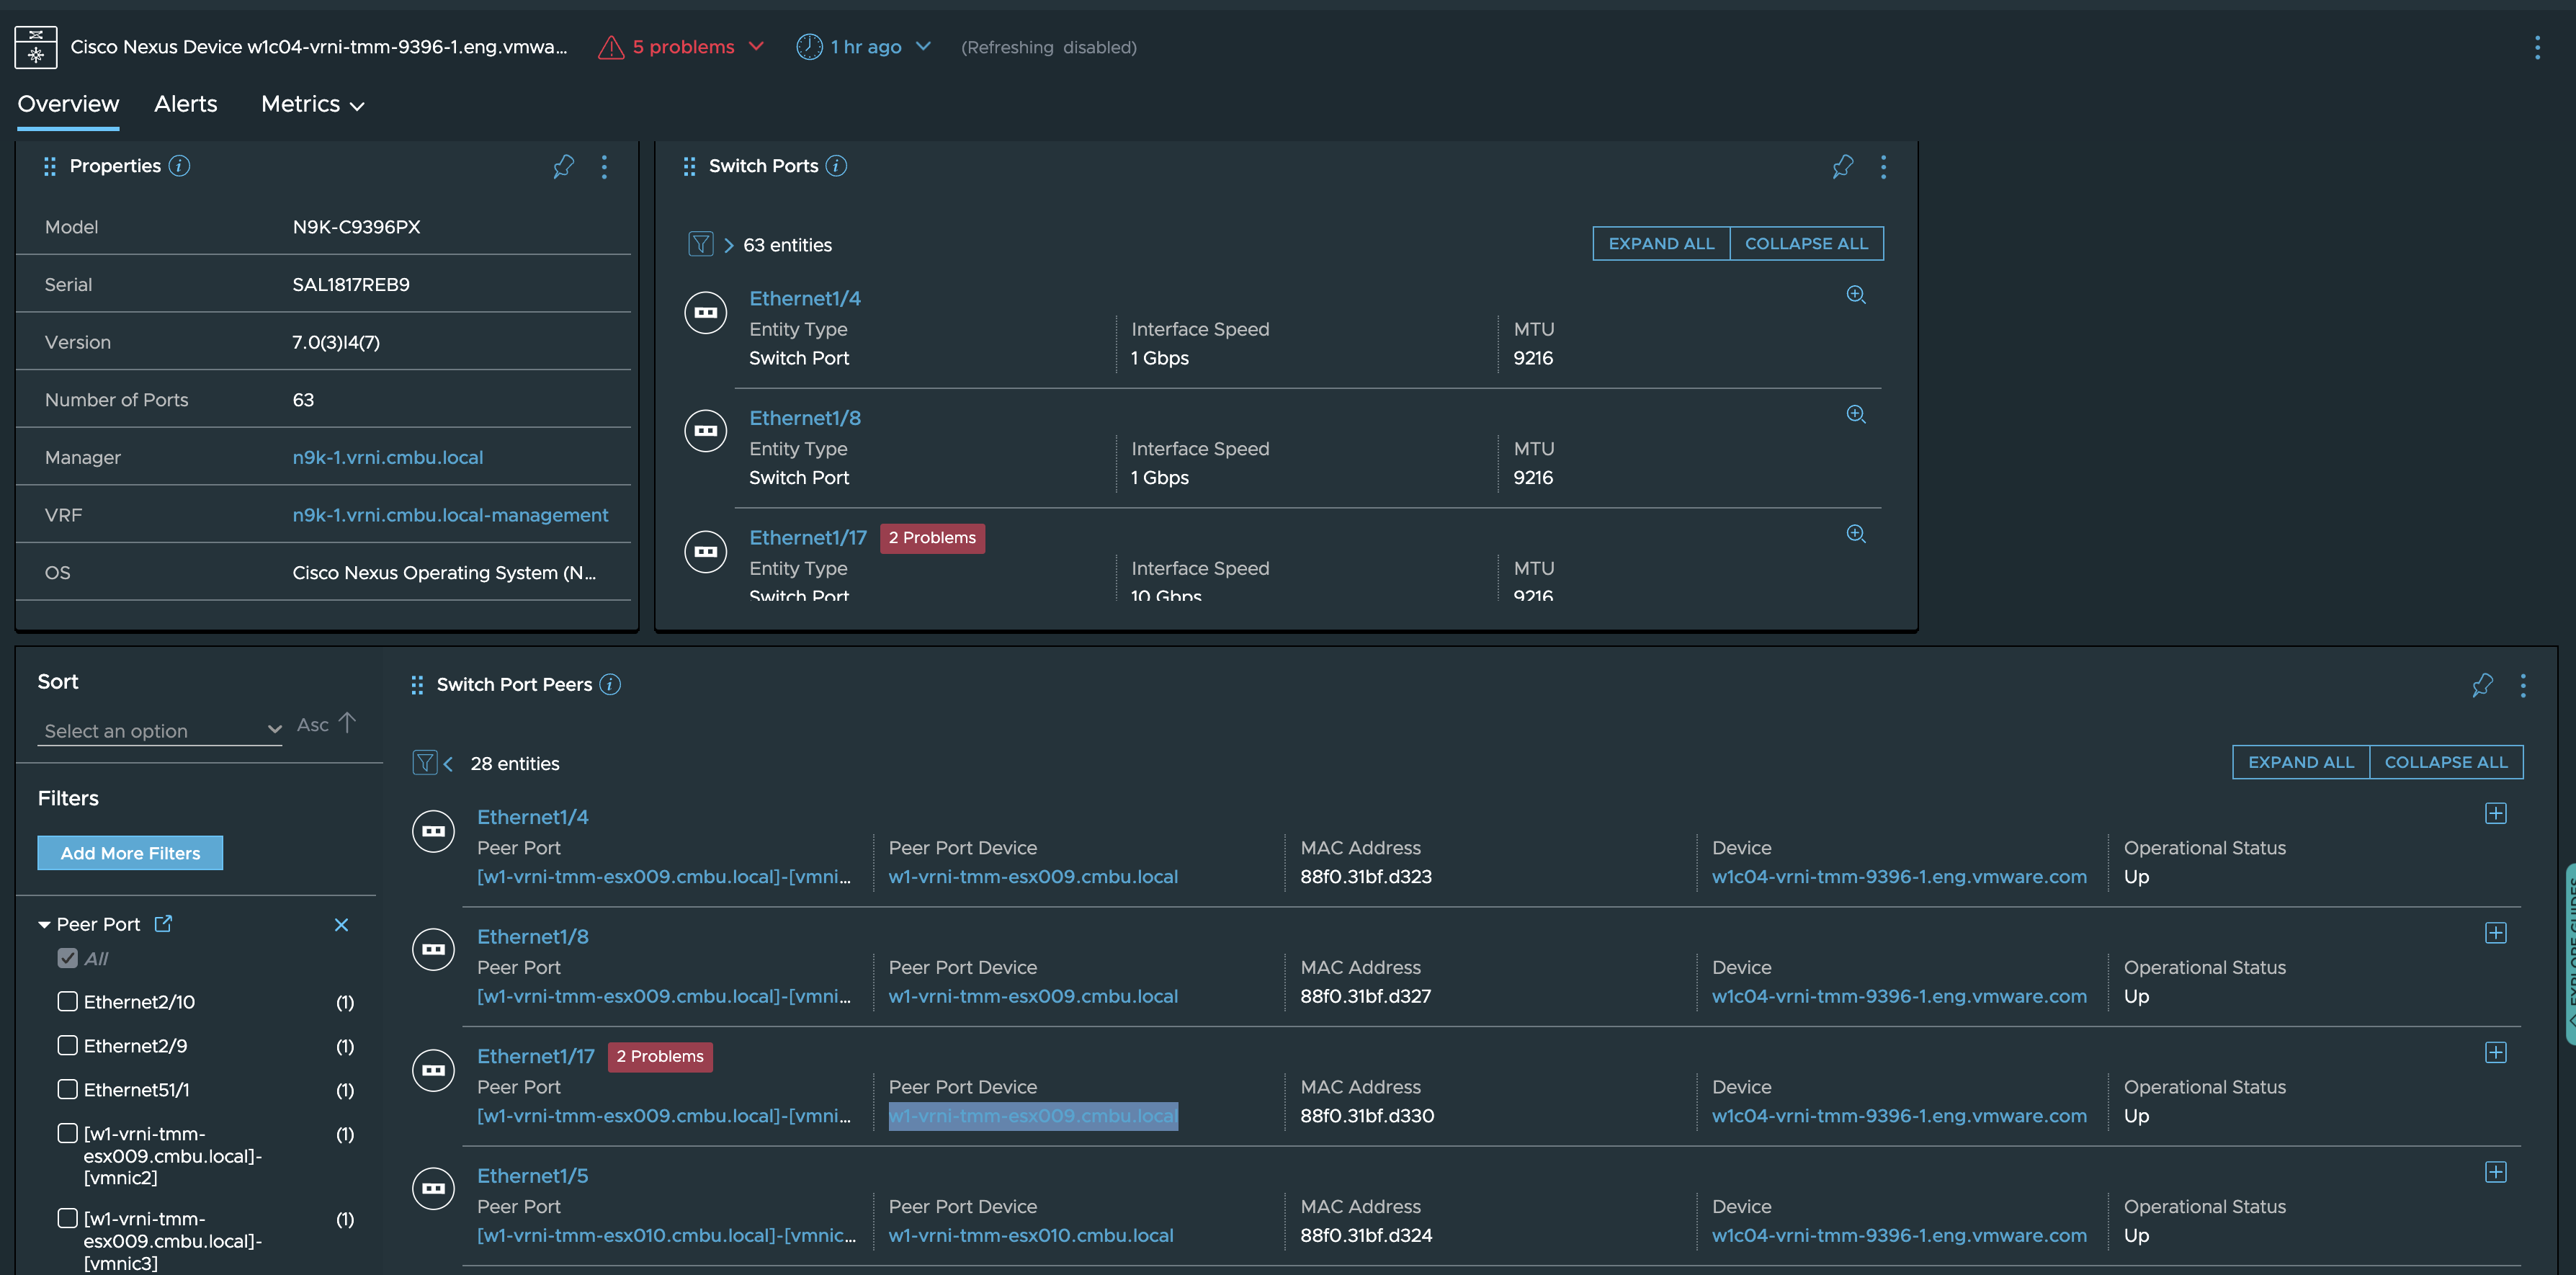
On this dashboard, you can find the ESX servers that this switch is connected to, so basically this switch works as TOR for a set of ESX servers. -
So, starting from an alert, we have now reached the ESX servers which could be impacted. From here, we will find the VMs on these servers, and the applications which rely on those VMs. We will see some vRNI queries for achieving this goal just to explore the power and flexibility that the vRNI queries provide us.
-
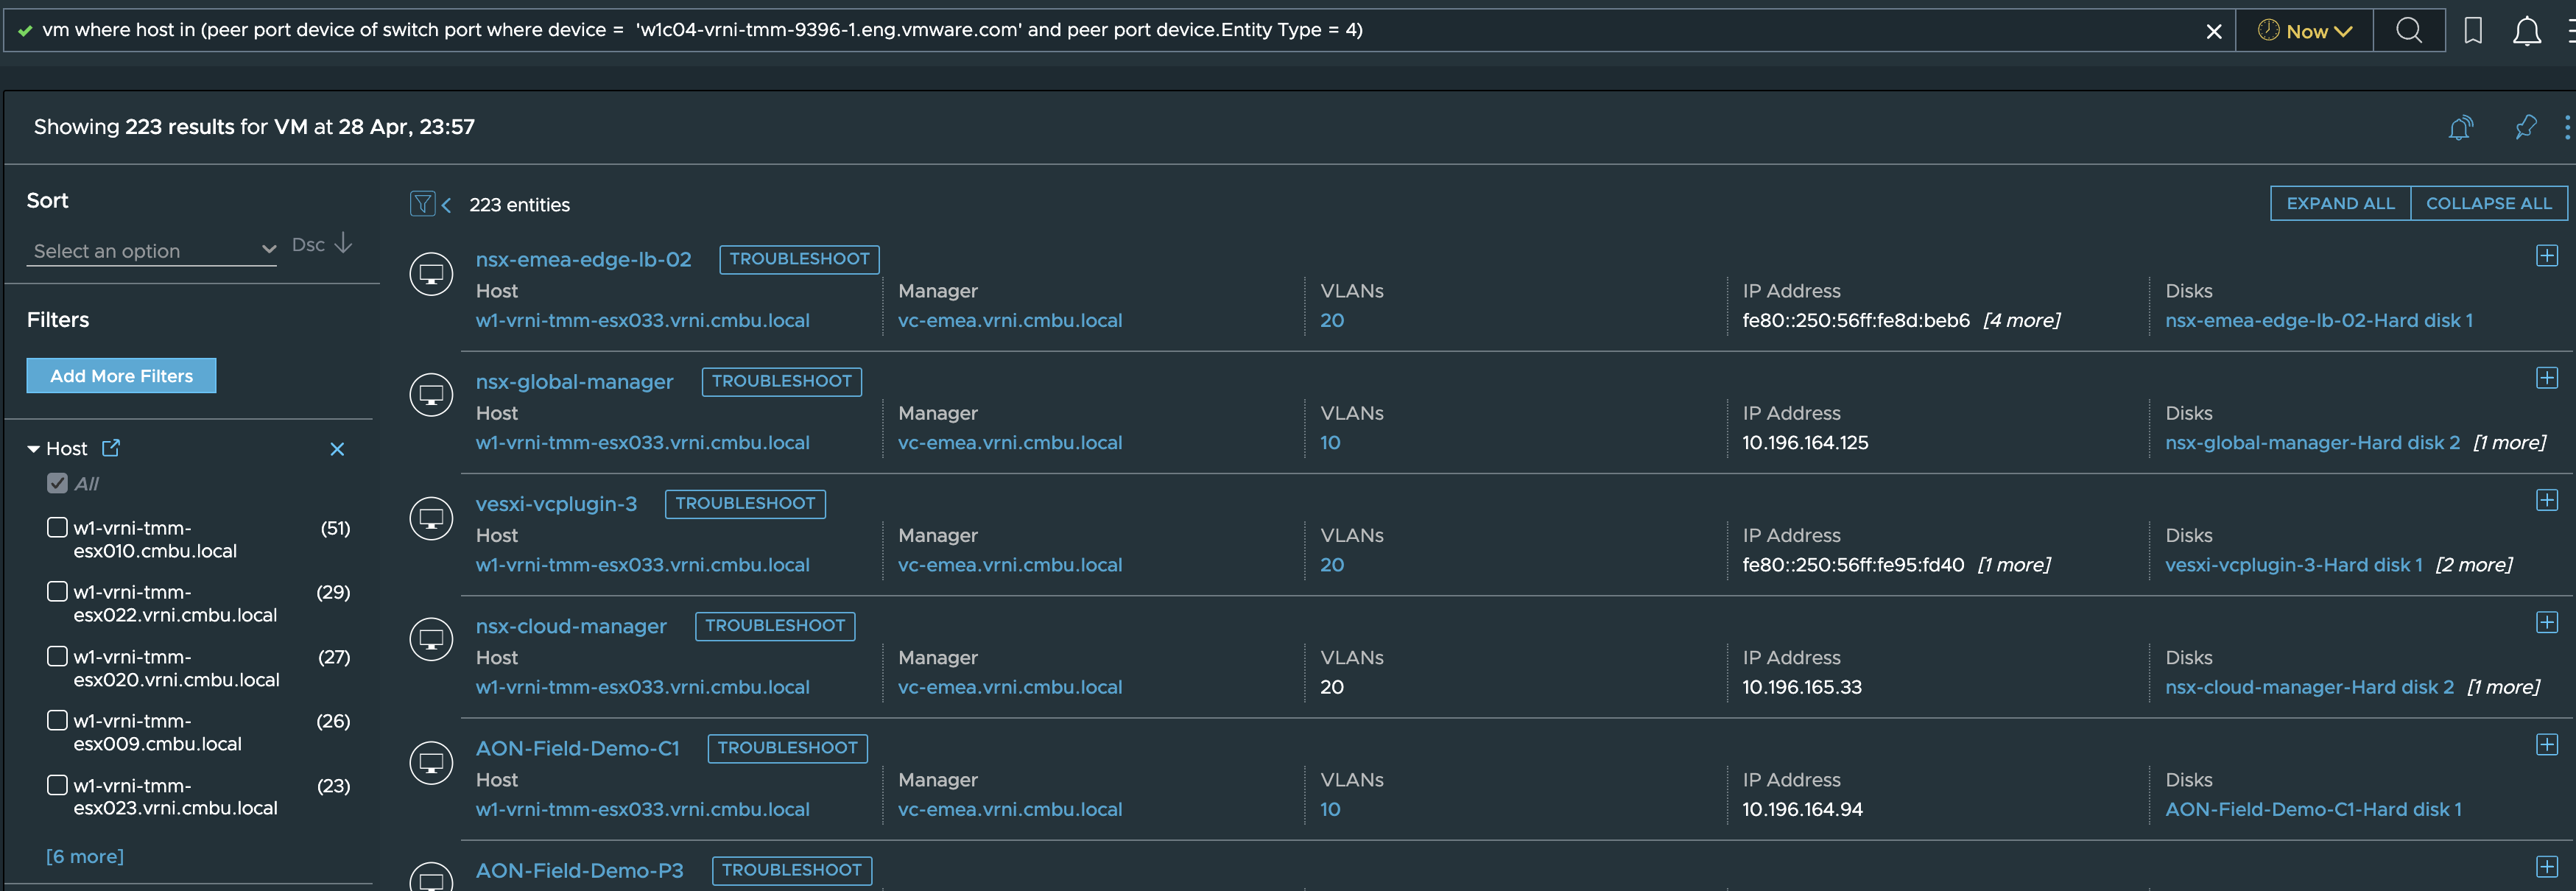
To find all the VMs we can use a query like: “vm where host in (peer port device of switch port where device = ’w1c04-vrni-tmm-9396-1.eng.vmware.com’ and peer port device.Entity Type = 4)” and this will get us all the VMs which could be in a potential issue:
-
But more than the VMs, we are interested in the applications, so we will have to use a slightly more complex query: “application where Virtual Member in (vm where host in (peer port device of switch port where device = ’w1c04-vrni-tmm-9396-1.eng.vmware.com’ and peer port device.Entity Type = 4))”, and this should give us a list of all the applications which could be showing the side effects of the issue seen at physical infrastructure level:
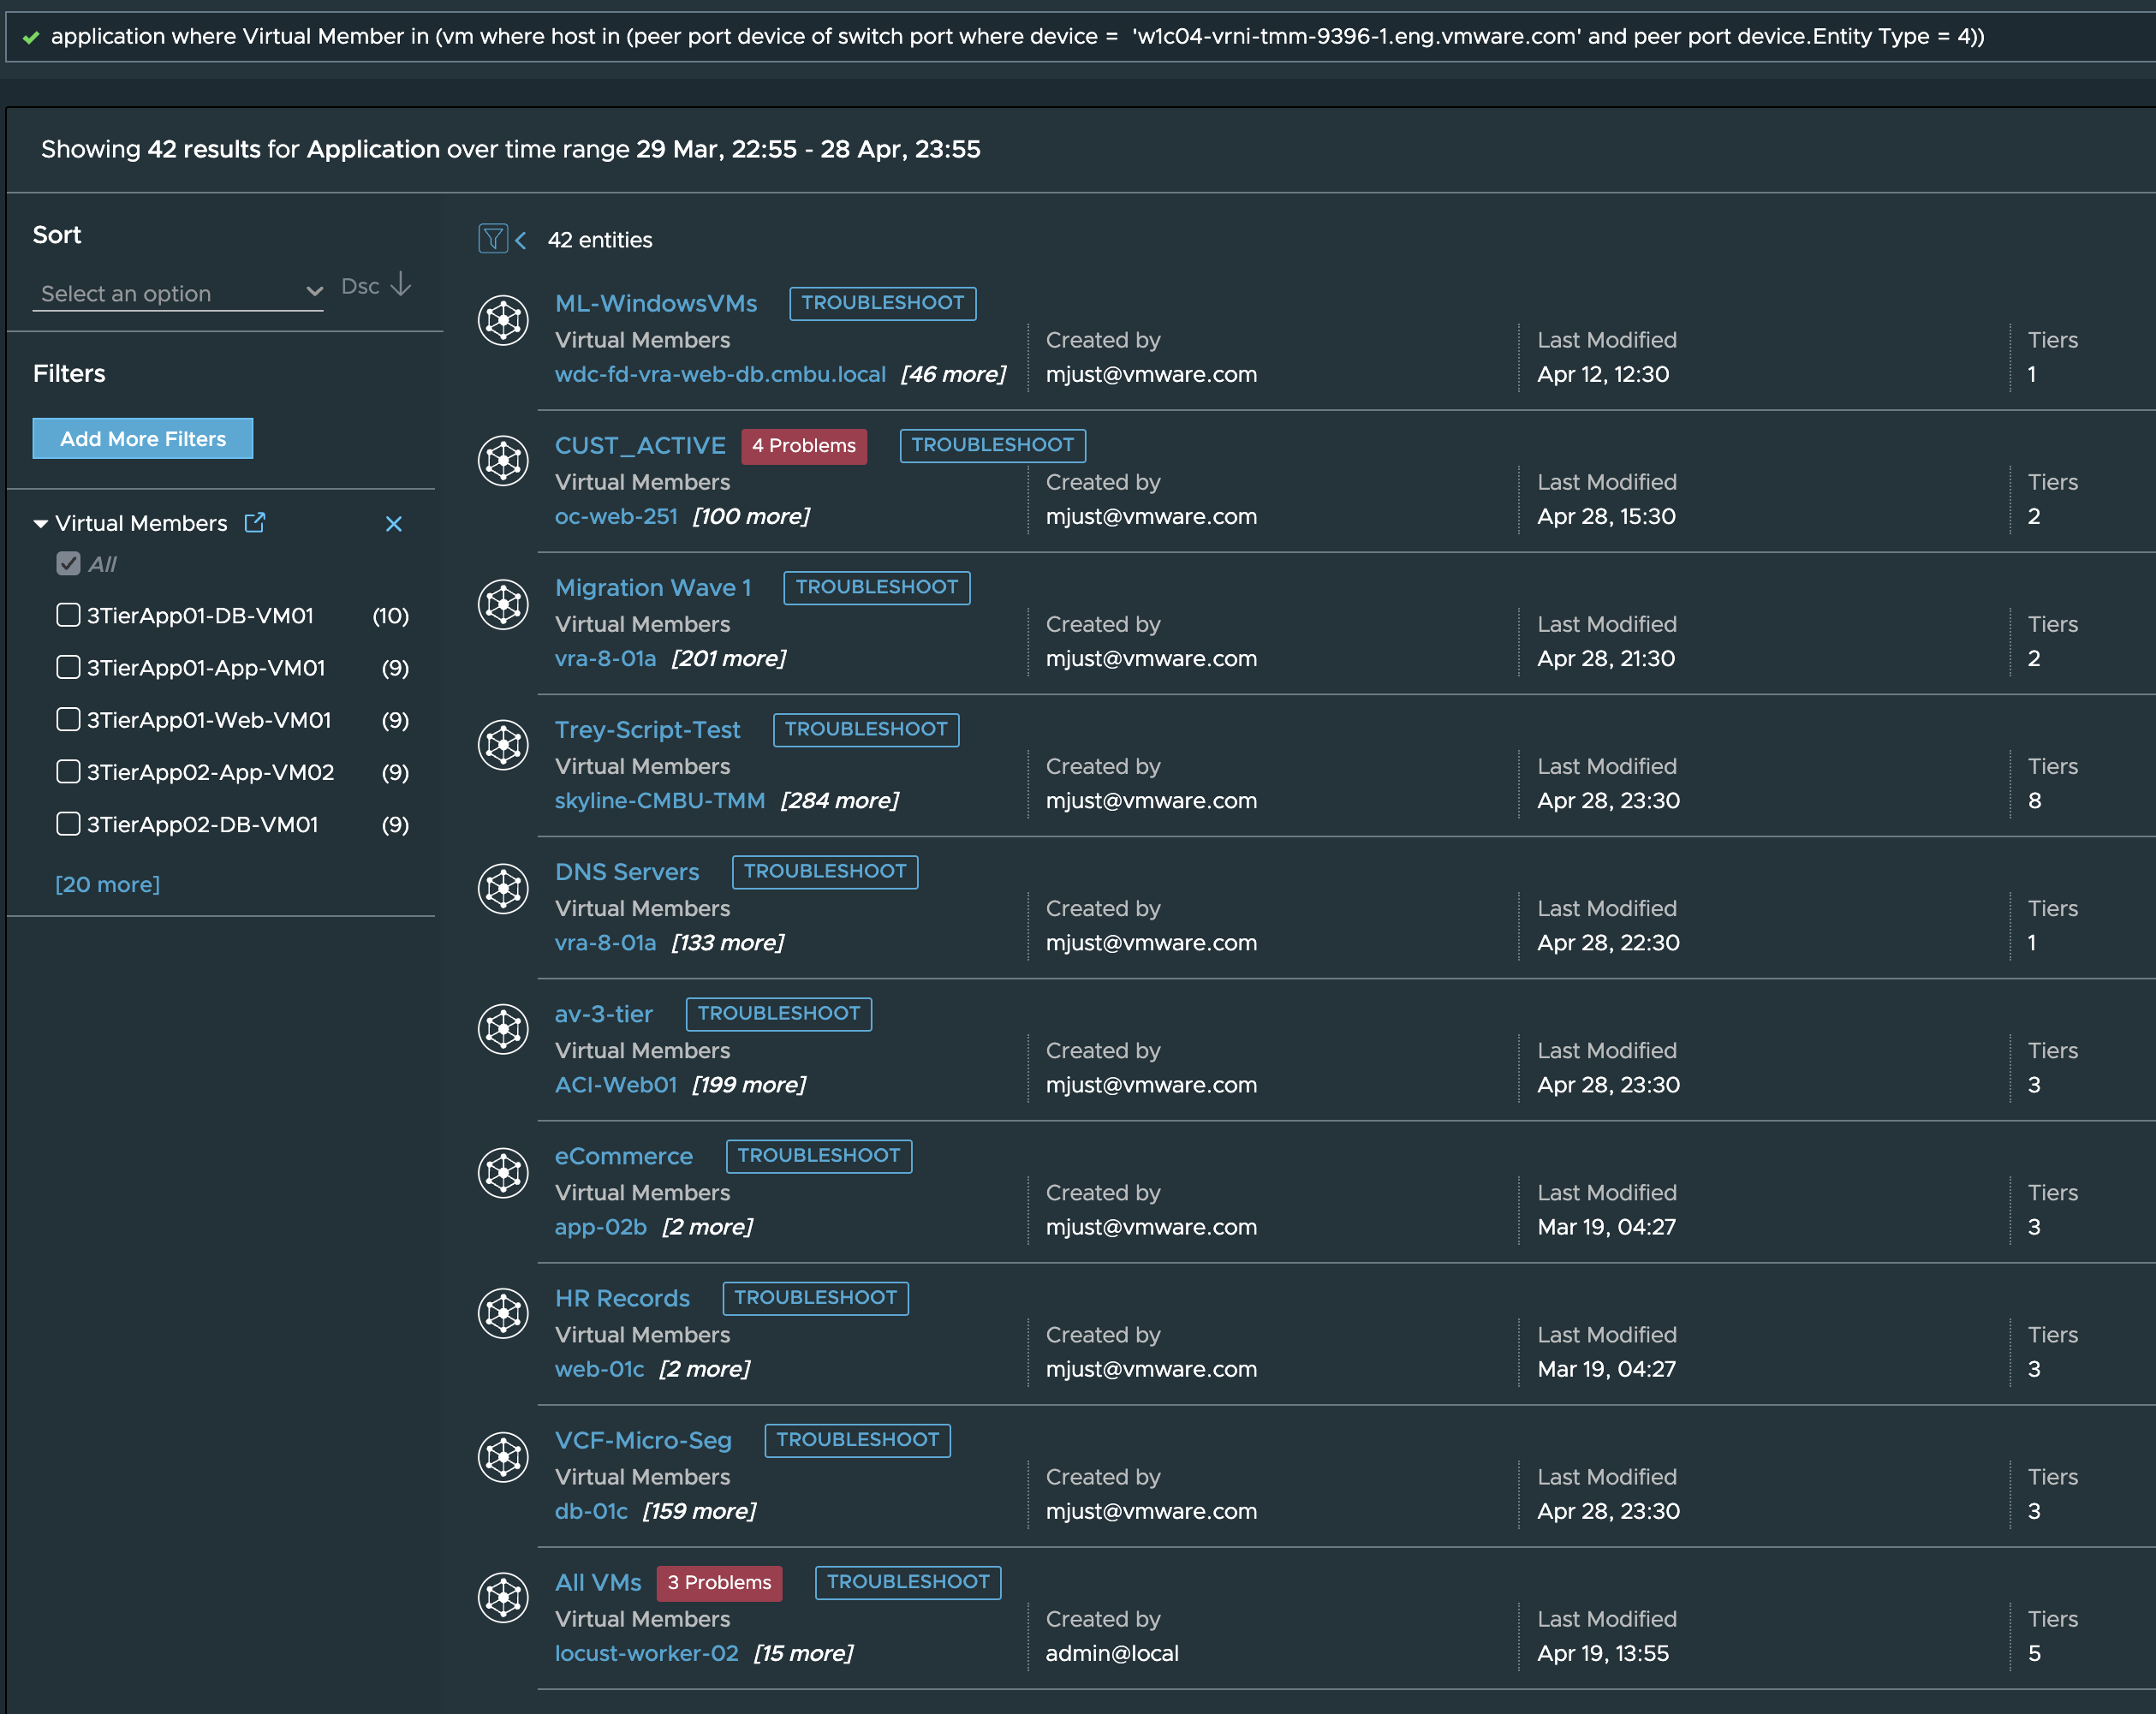
Now that you have a list of the applications, you can potentially proactively warn the application owners of any issues they might be experiencing in their application, or any upcoming down time which could impact their applications when you fix things at the physical infrastructure level.
You could also build a custom dashboard of all the applications that rely on the infrastructure that you are supposed to manage so that you can come to know if any new applications start relying on your infrastructure, which can help you gauge any capacity impact the new applications could cause on the underlying networking infrastructure or for ensuring that the DR infrastructure is capable of taking on the load in case of any failovers.
Other alerts and their entity dependencies can similarly be traversed to figure out their blast radius or impact zone so that preemptive action can be taken.
vRNI has humongous amount of data in the form of versioned, granular and strongly connected configuration graph, flows, metrics, alerts, application definitions etc. from physical as well as virtual datasources, owing to which vRNI is like a treasure trove that has something for every type of user persona.
Check out the other blogs in this series to gain a better understanding of how you can benefit from having vRNI in your environment and if you already have vRNI, then how you can use it to its best potential.