Alerts Insights
Depending on the datasources added, vRNI can end up showing a really large number of alerts generated across configurations, metrics, flows etc.
Too much information dumped on the users can lead to analysis paralysis.

So in this blog we will go over some queries that can be used to build an alerts summary dashboard for monitoring or exec overview.
-
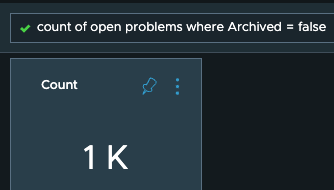
Getting a count of all open problems in vRNI, these can be alerts opened by vRNI itself or alerts routed from other datasources like NSX-T or K8S:
Query: “count of open problems where Archived = false”Sample result:
-
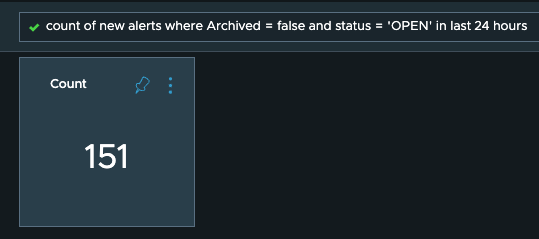
Getting a count of new problems opened in last 24 hours, this can tell you if something of significant impact happened in last 24 hours and needs to be rolled back. Query: “count of new alerts where Archived = false and status = ‘OPEN’ in last 24 hours”
Sample result:
-
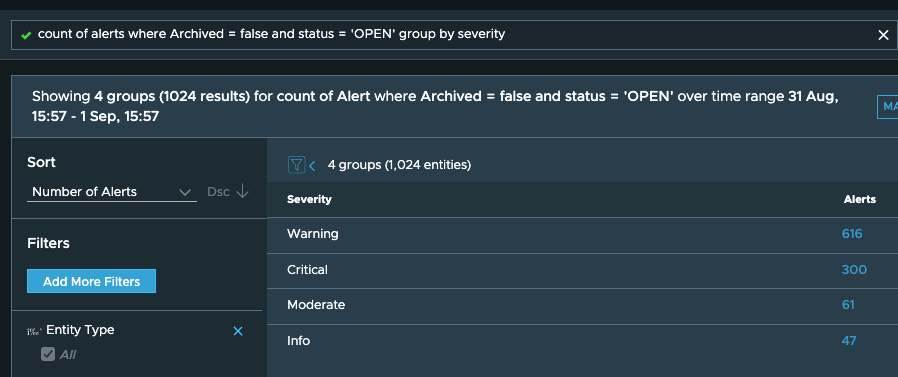
Getting count of all open problems for every severity level, this way you can target the critical ones first Query: “count of alerts where Archived = false and status = ‘OPEN’ group by severity”
Sample Result:
-
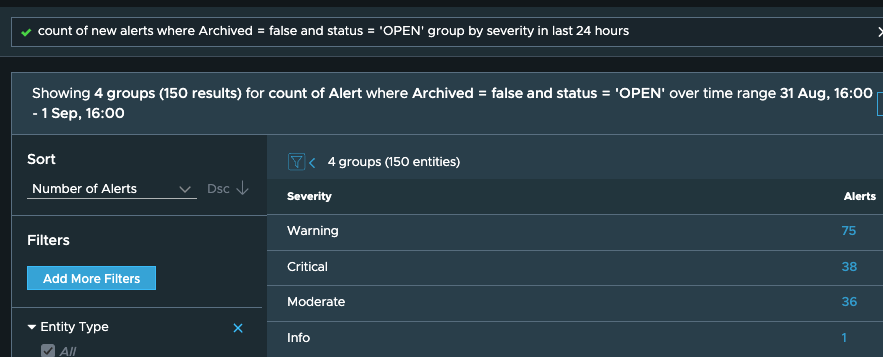
Getting count of new problems for every severity level opened in last 24 hours, this way you can target the critical ones firstQuery: Query: “count of new alerts where Archived = false and status = ‘OPEN’ group by severity in last 24 hours”
Sample Result:
-
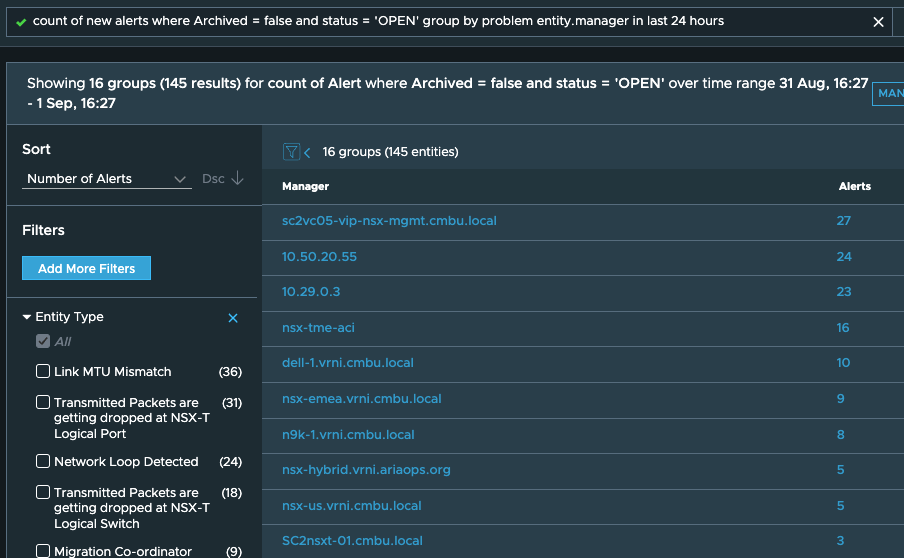
Getting a count of new problems opened in last 24 hours based on the datasource for which the alert was created. This should help you find datasources which seem severely faulty and deserving attention. Query: “count of new alerts where Archived = false and status = ‘OPEN’ group by problem entity.manager in last 24 hours”
Sample Result:
-
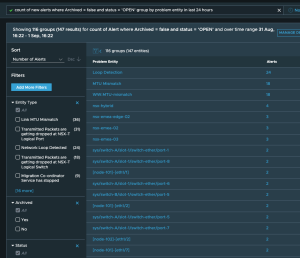
Getting count of new problems opened in last 24 hours based on the specific problematic object for which the alert was created. This should help you see which entity has the most issues and deserves immediate attention Query: “count of new alerts where Archived = false and status = ‘OPEN’ group by problem entity in last 24 hours”
Sample Result:
-
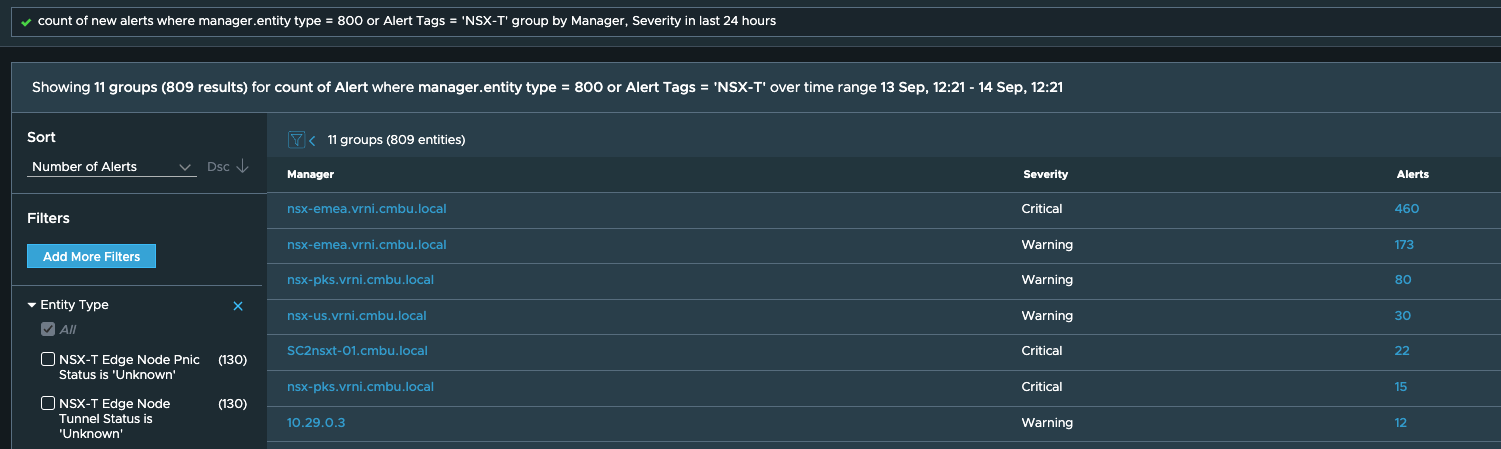
Getting count of new problems opened in last 24 hours for your virtual networking infrastructure grouped by severity of the problem. Query: “count of new alerts where manager.entity type = 800 or Alert Tags = ‘NSX-T’ group by Manager, Severity in last 24 hours”
Sample Result:
-
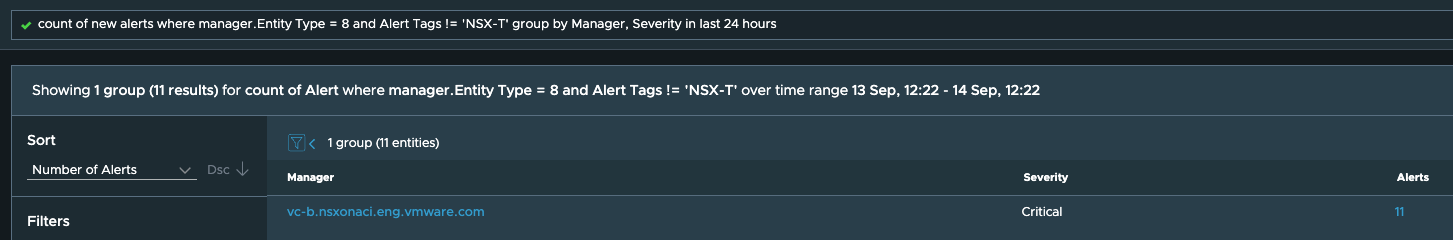
Getting count of new problems opened in last 24 hours for your virtual compute infrastructure grouped by severity of the problem. Query: “count of new alerts where manager.Entity Type = 8 and Alert Tags != ‘NSX-T’ group by Manager, Severity in last 24 hours”
Sample Result:
-
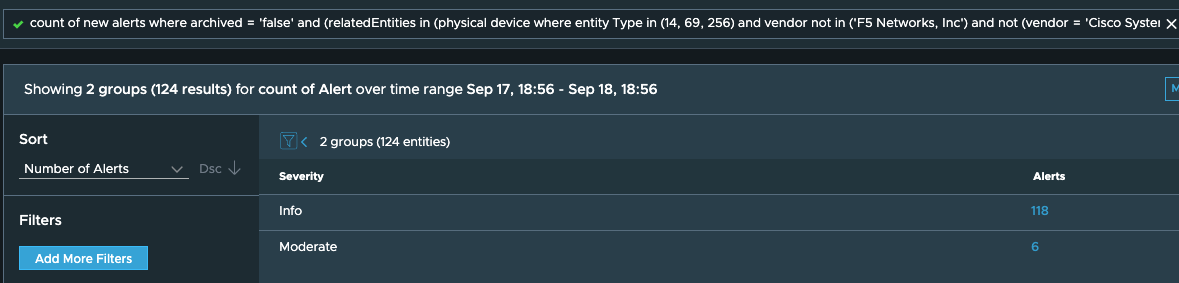
Getting count of new problems opened in last 24 hours for your physical networking infrastructure grouped by severity of the problem. Query: “count of new alerts where archived = ‘false’ and (relatedEntities in (physical device where entity Type in (14, 69, 256) and vendor not in (‘F5 Networks, Inc’) and not (vendor = ‘Cisco Systems, Inc.’ and model like ‘ASA’))) group by severity in last 24 hours”
Sample Result:
-
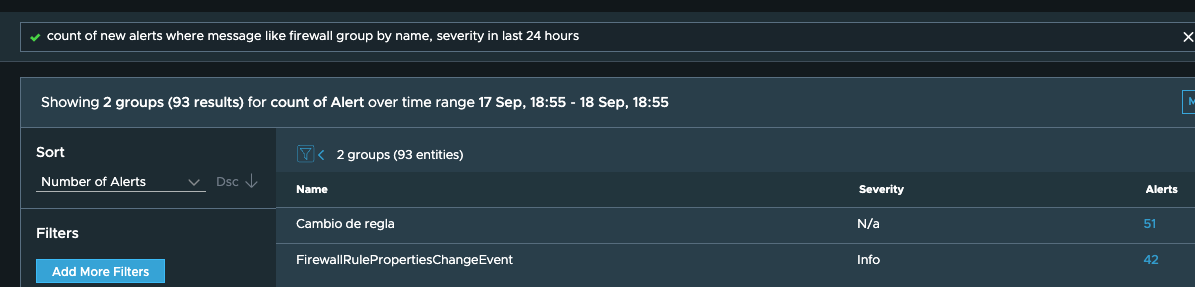
Getting count of new problems opened in last 24 hours for your firewalls Query: “count of new alerts where message like firewall group by name, severity in last 24 hours”
Sample Result:
Now, it would be tedious to create such a dashboard by entering these queries manually on the multiple vRNI setups in your environment. Dashboard Exchange has a dashboard definition that you can instead use to create the alerts insight dashboard on your setups: https://github.com/amolvaikar/vrni-dashboard-exchange/blob/main/pinboards/alerts_insights/alerts_summary.json