Using GNT for NSX-T Transport Node Troubleshooting
As of 6.6, Guided Network Troubleshooting (GNT) in NSX-T space is supported for Edge Transport Node (ETN).
So here we will explore some of the scenarios where:
- Transport Node GNT could be helpful for the customers
- GNT for Edge TN could be a logical starting point for the customer
Scenario 1:
Admin gets a complaint that communication between application VMs and the DB is broken or is very slow or has intermittent problem some times
Example 1.
App or Web tier/service of an application is running on a VM connected to a NSX-T Segment and it is depending on a DB server running on a VM on a legacy VLAN, and this communication is broken or is very slow or has intermittent failures.
Example 2:
App or Web tier/service of an application is running on a VM connected to a NSX-T Segment and it is depending on a DB server running on a bare metal server which is not managed and monitored by vmware products, and this communication is broken or is very slow or has intermittent failures
Example 3:
App or Web tier/service of an application is running on a VM connected to a NSX-T Segment and it is depending on a DB server running on AWS VPC, and this communication is broken or is very slow or has intermittent failures.
For this scenario, vRNI customers could carry out a troubleshooting exercise in the following manner:
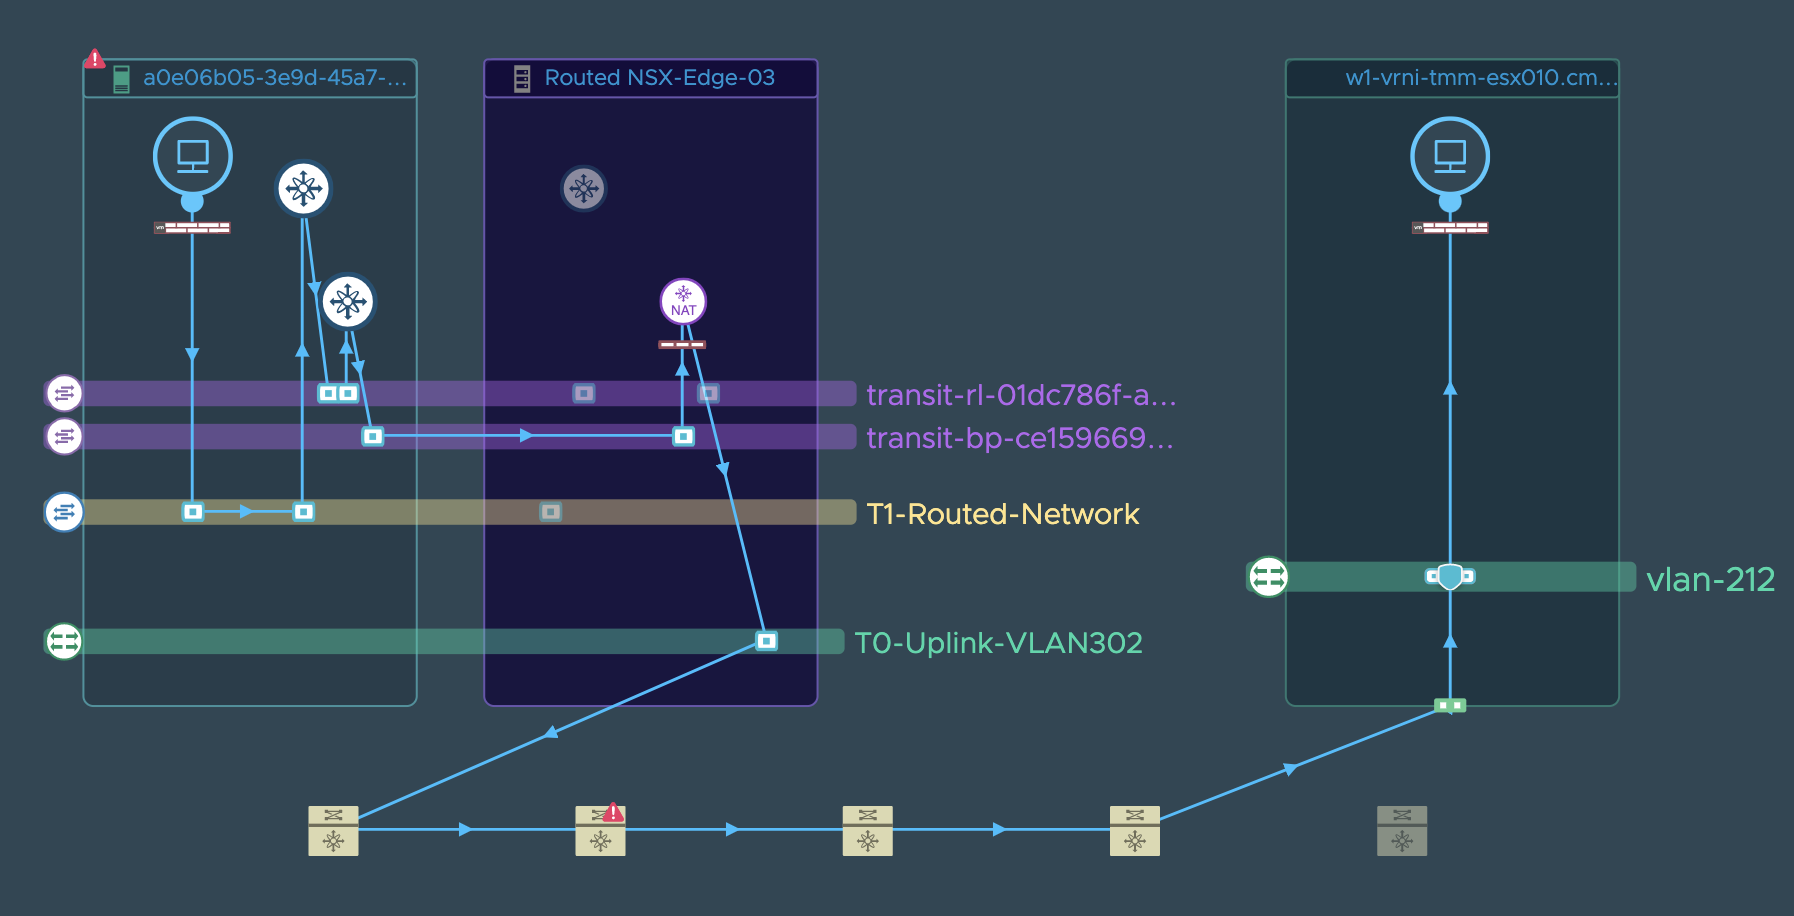
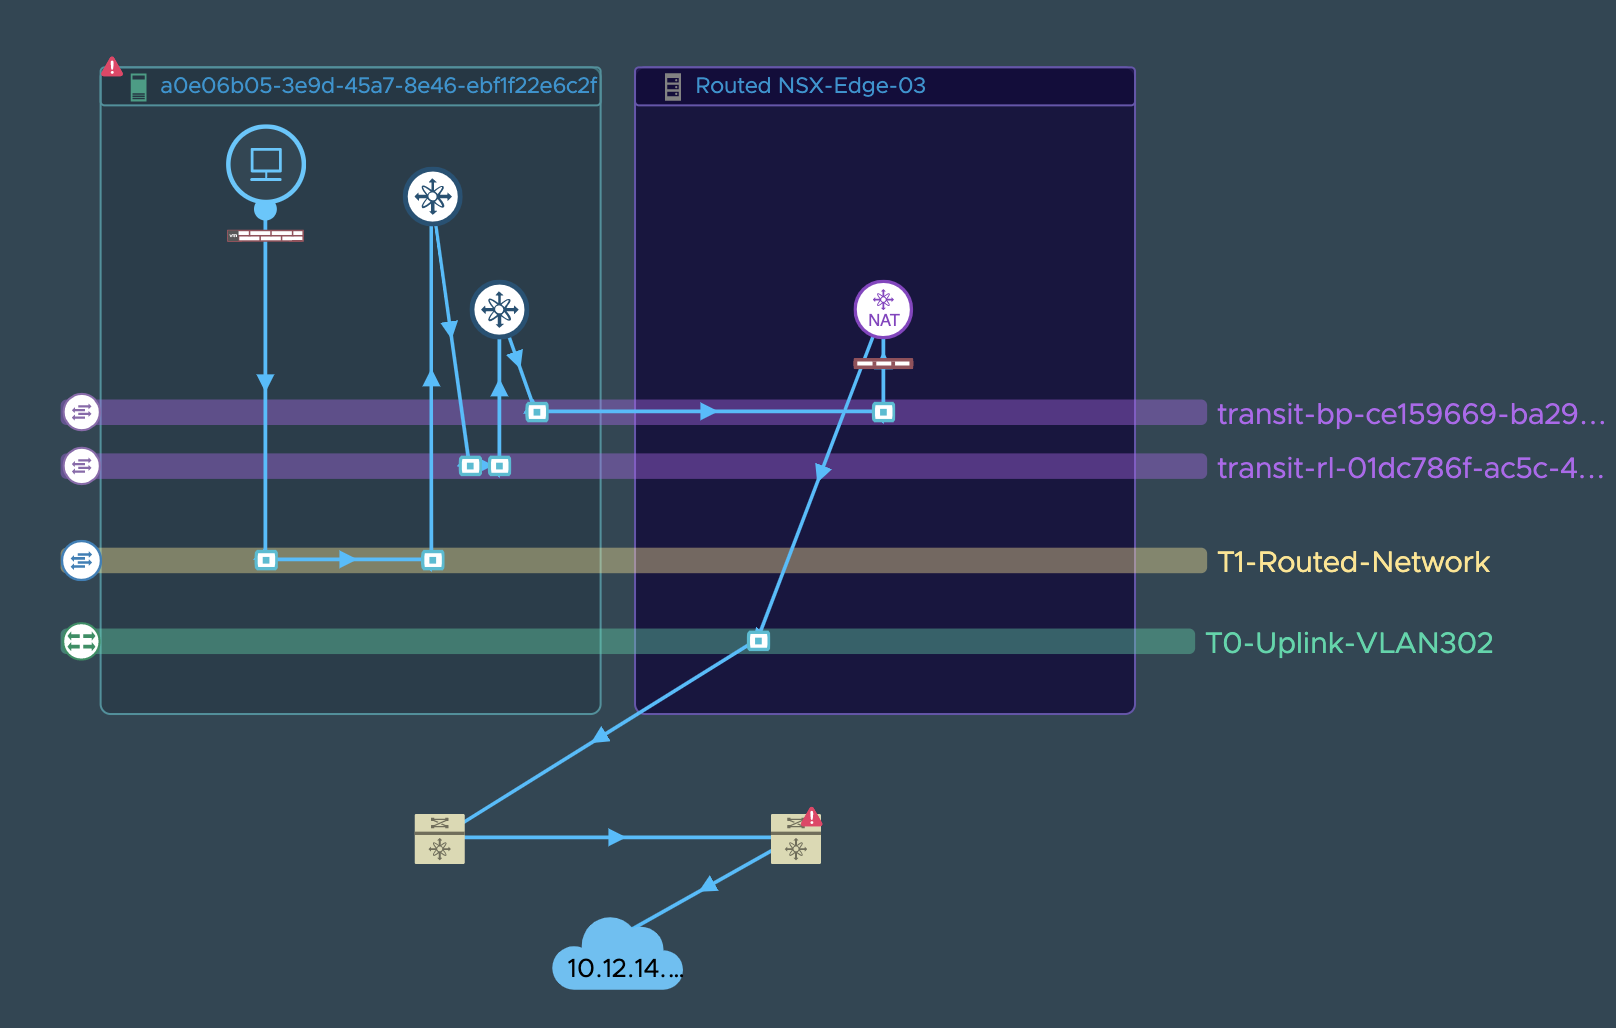
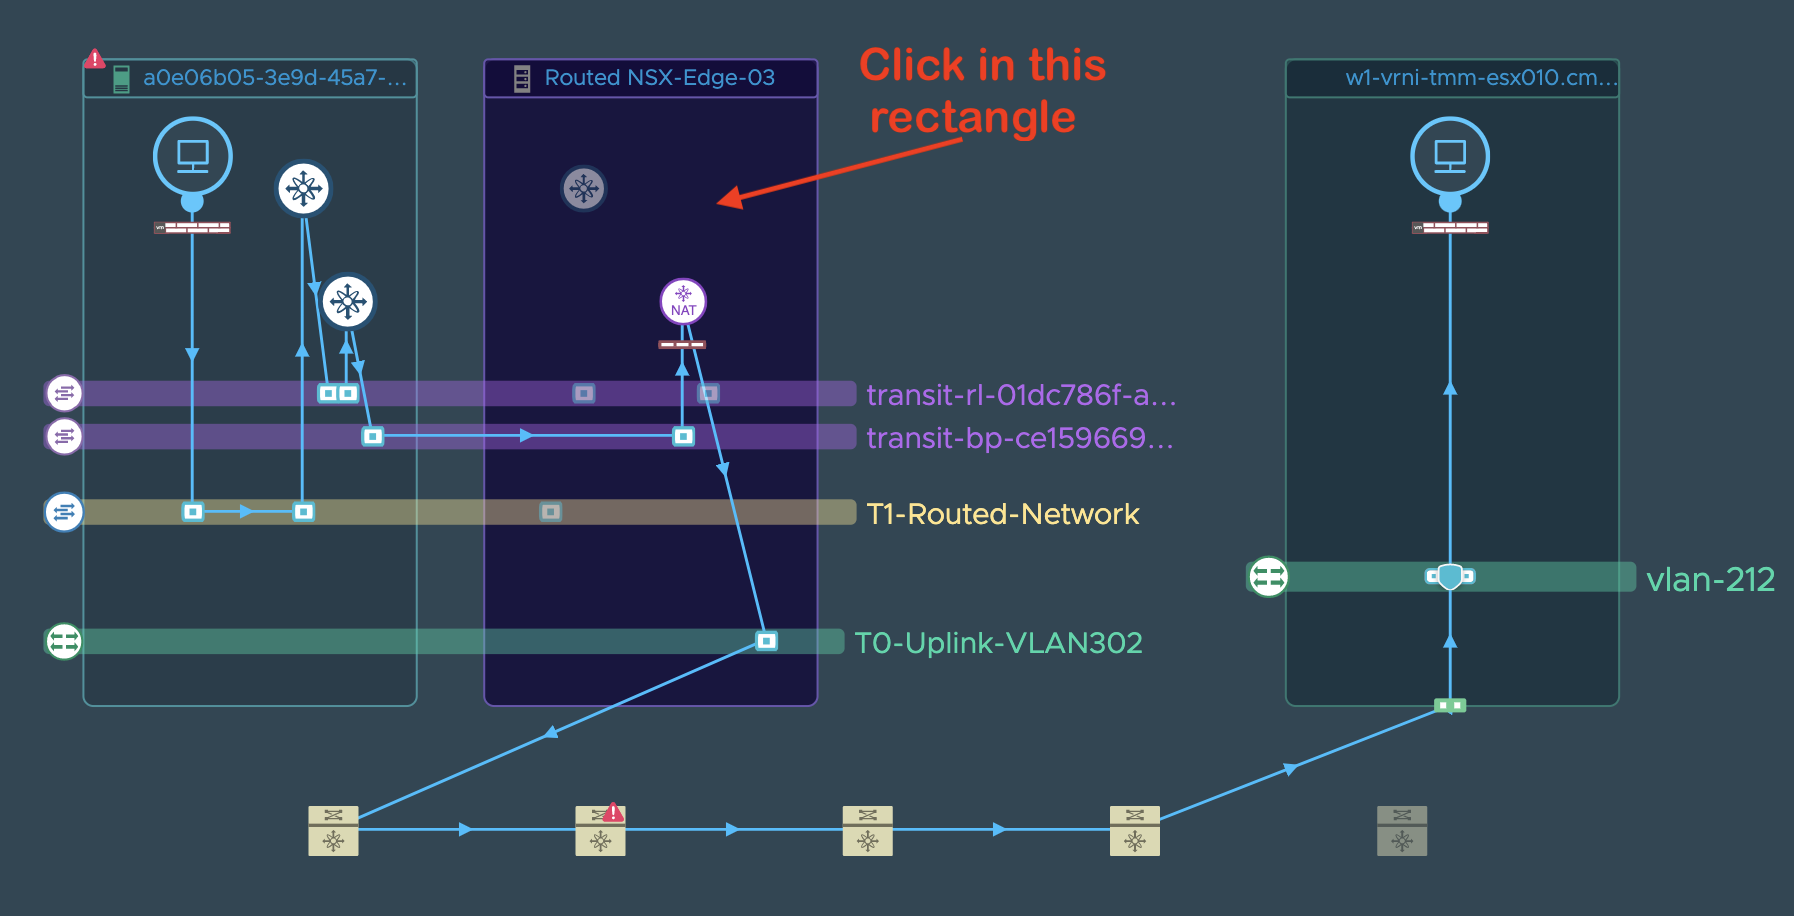
**Step 1**: vRNI user looks for the path between the application
VM and the DB VM/IP. vRNI will render a VM to VM/IP path as shown in the
example screenshots above. If vRNI throws an error during path
resolution inspite of the user having added all appropriate datasources,
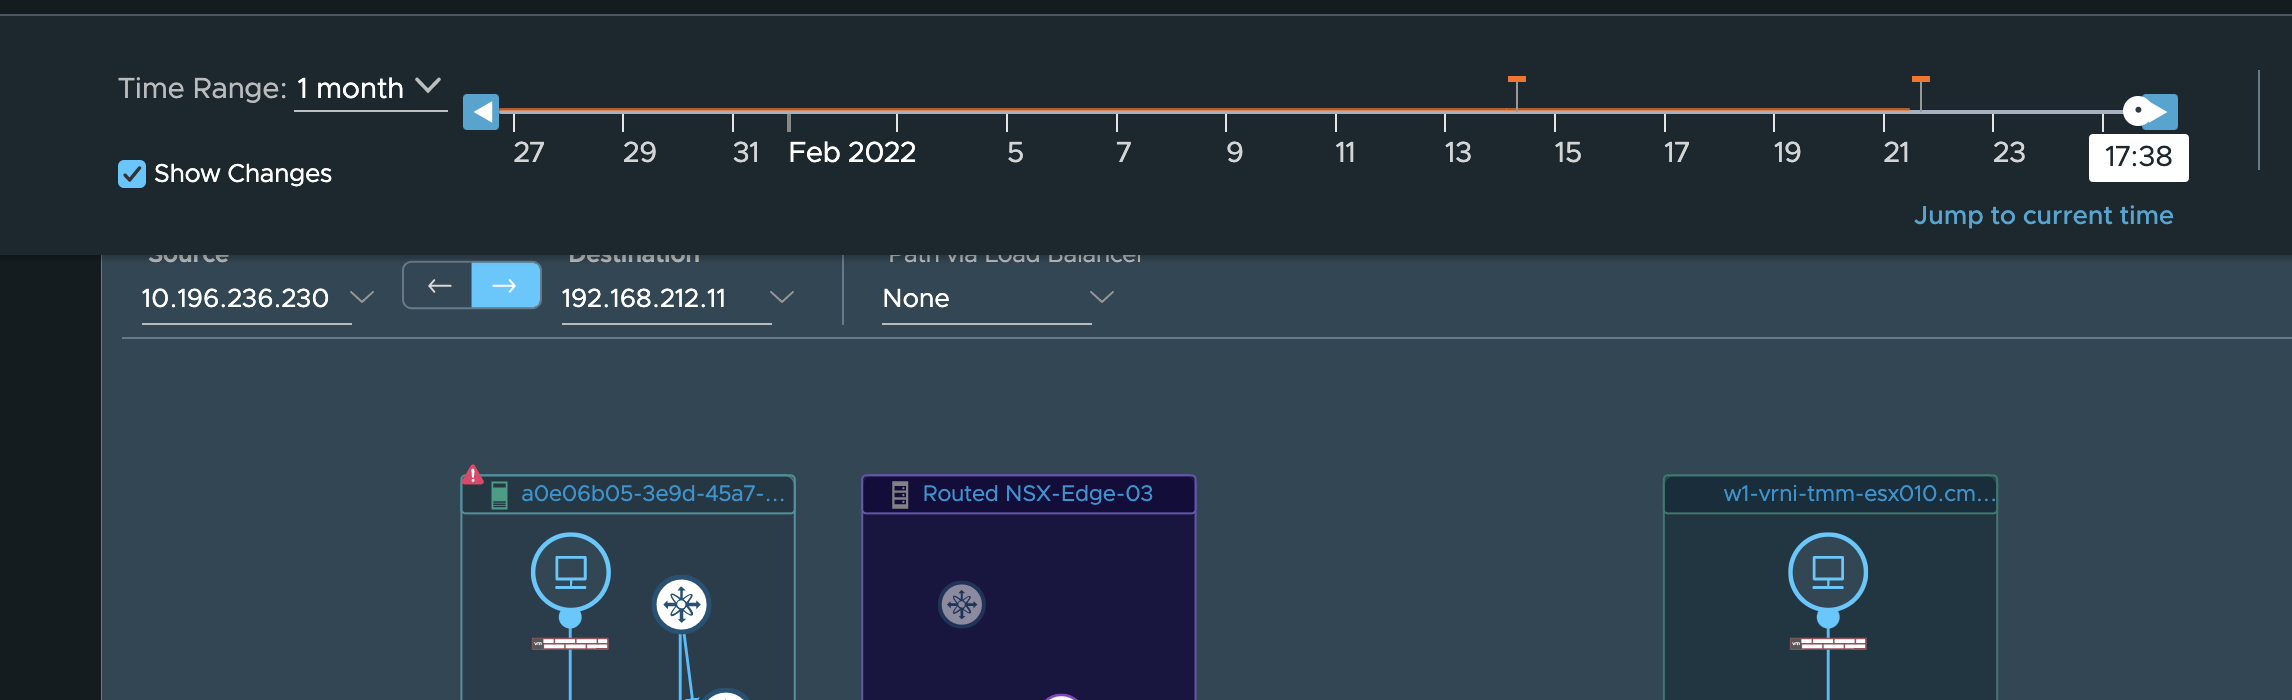
then it is very likely a configuration/route issue. User can check if
anything changed in the path configuration by making use of the timeline
tool on the VM to VM path page as seen here.
We wont go more into the depths of this possibility as that is not the main aim of this guide. So we will assume that no configuration change happened and vRNI renders the vm to vm/ip path without any problem.
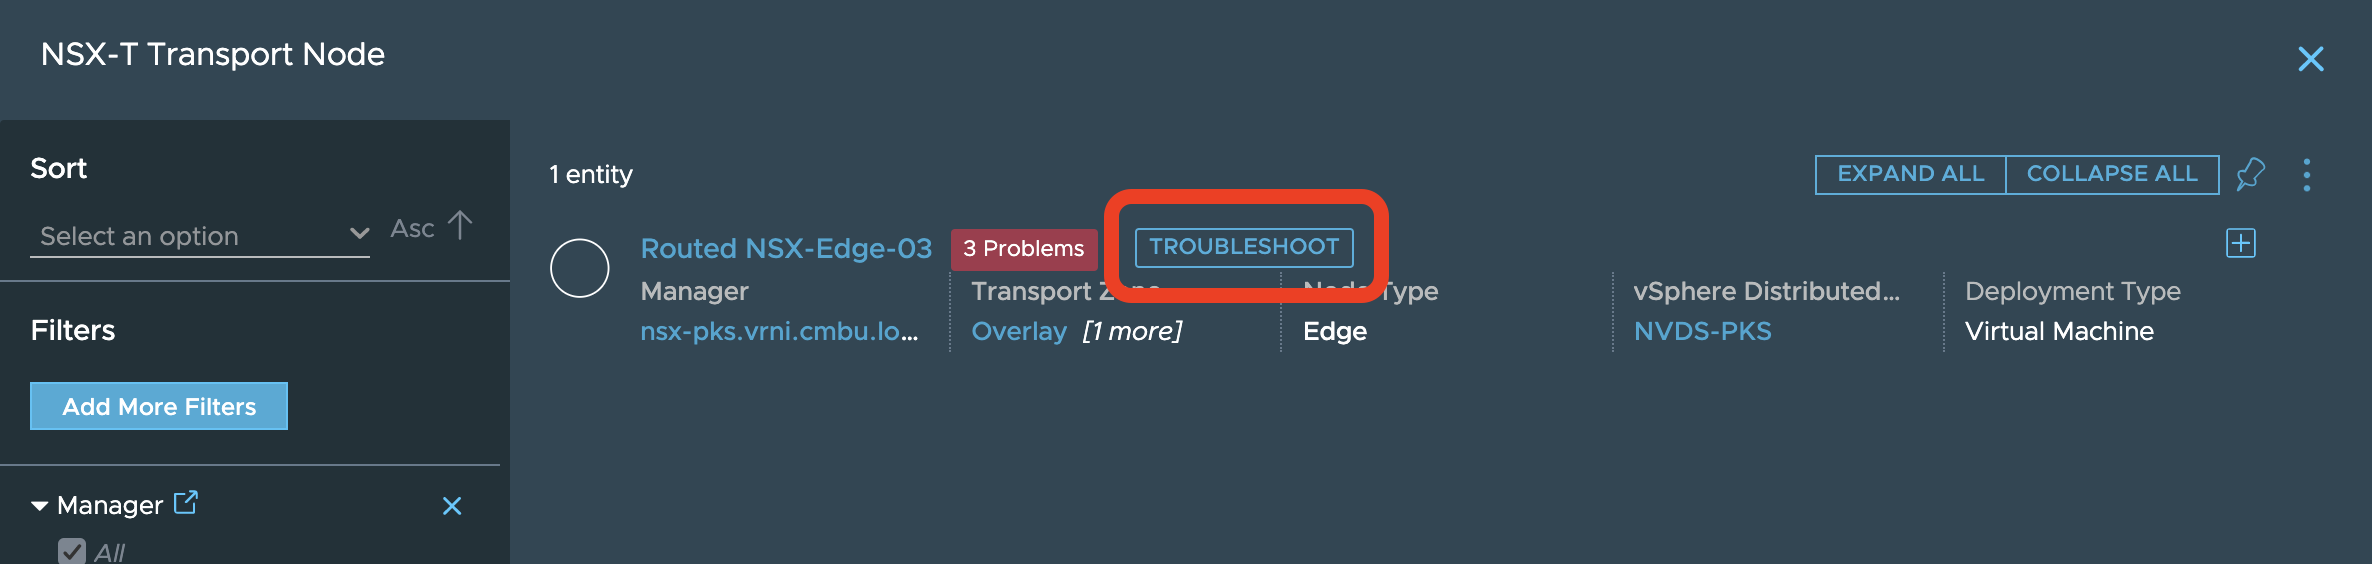
**Step 2**: Now, GNT can be started from the VM level itself, but
since that is not the aim of this document and we are specifically
concentrating on the ETN, we will assume that all is well at the VM and
VM’s host level and that this issue is seen on several VMs so the VM
tier is ruled out as a suspect in this problem and we move on to the
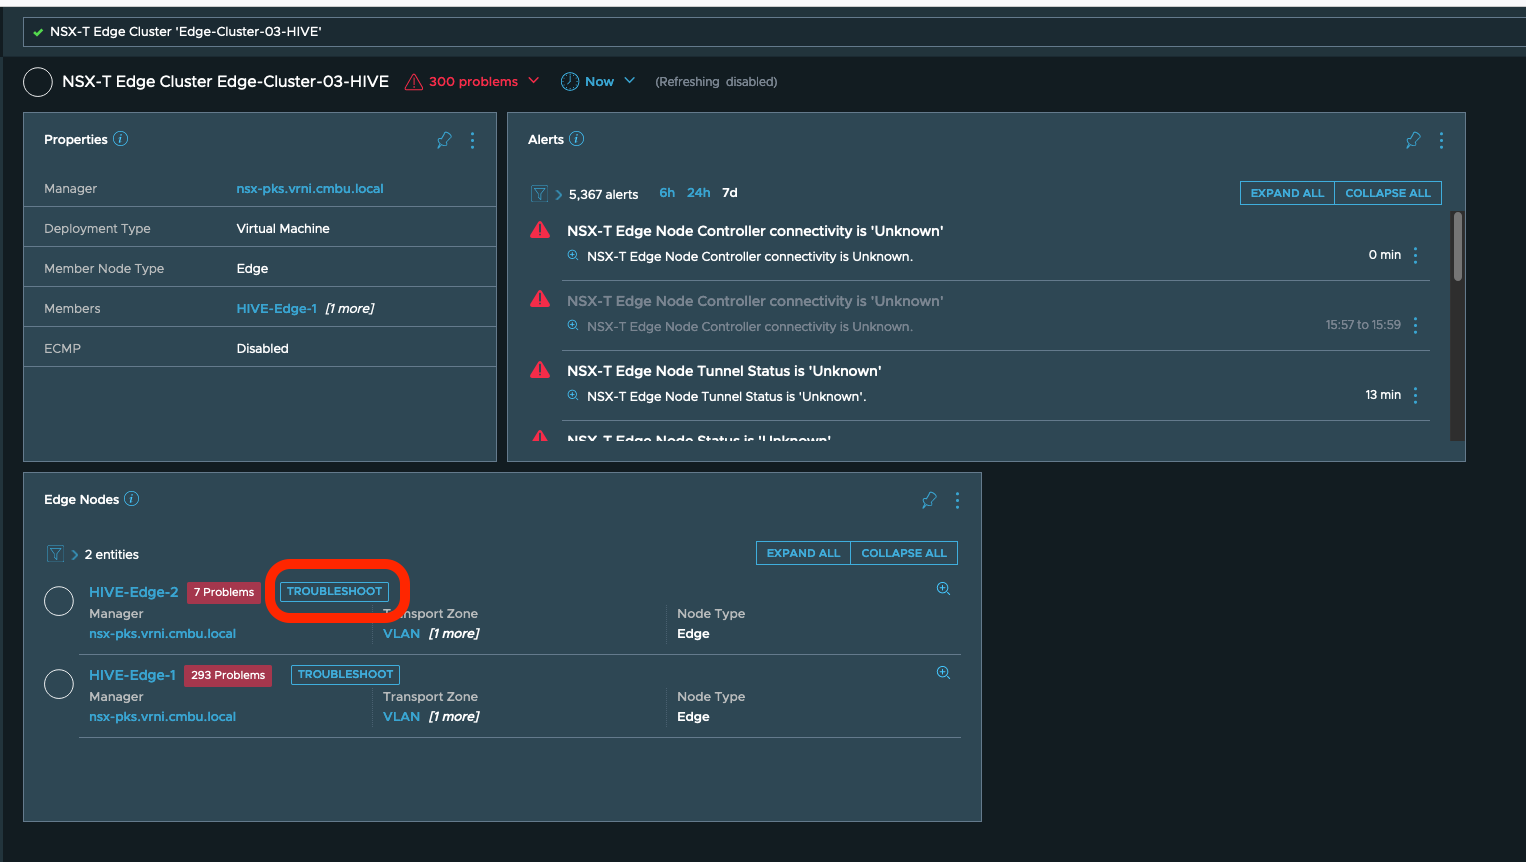
ETN. User clicks on the ETN and then chooses the troubleshoot option as
seen here to start a new GNT session:
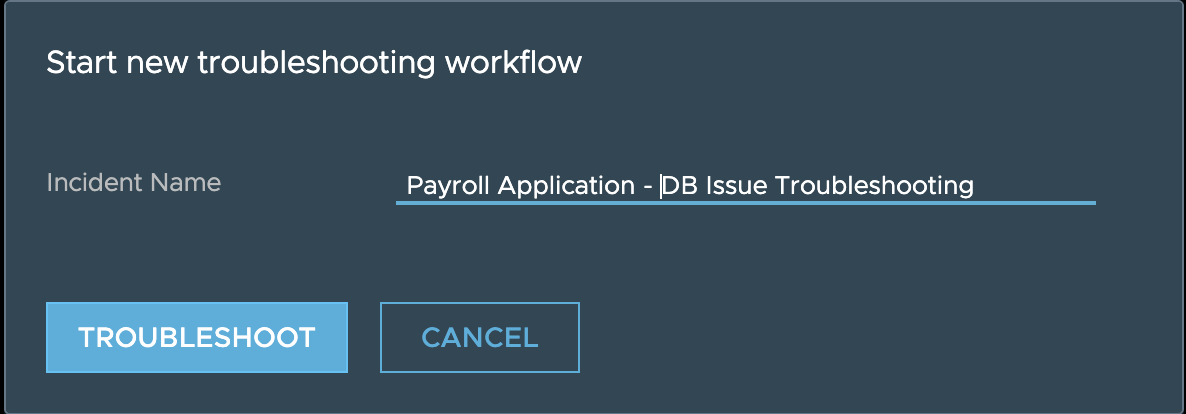
This should lead to a popup with the troubleshooting option like:
**Step 3**: Once user clicks on the troubleshooting option, they will need to give a name for the troubleshooting session:
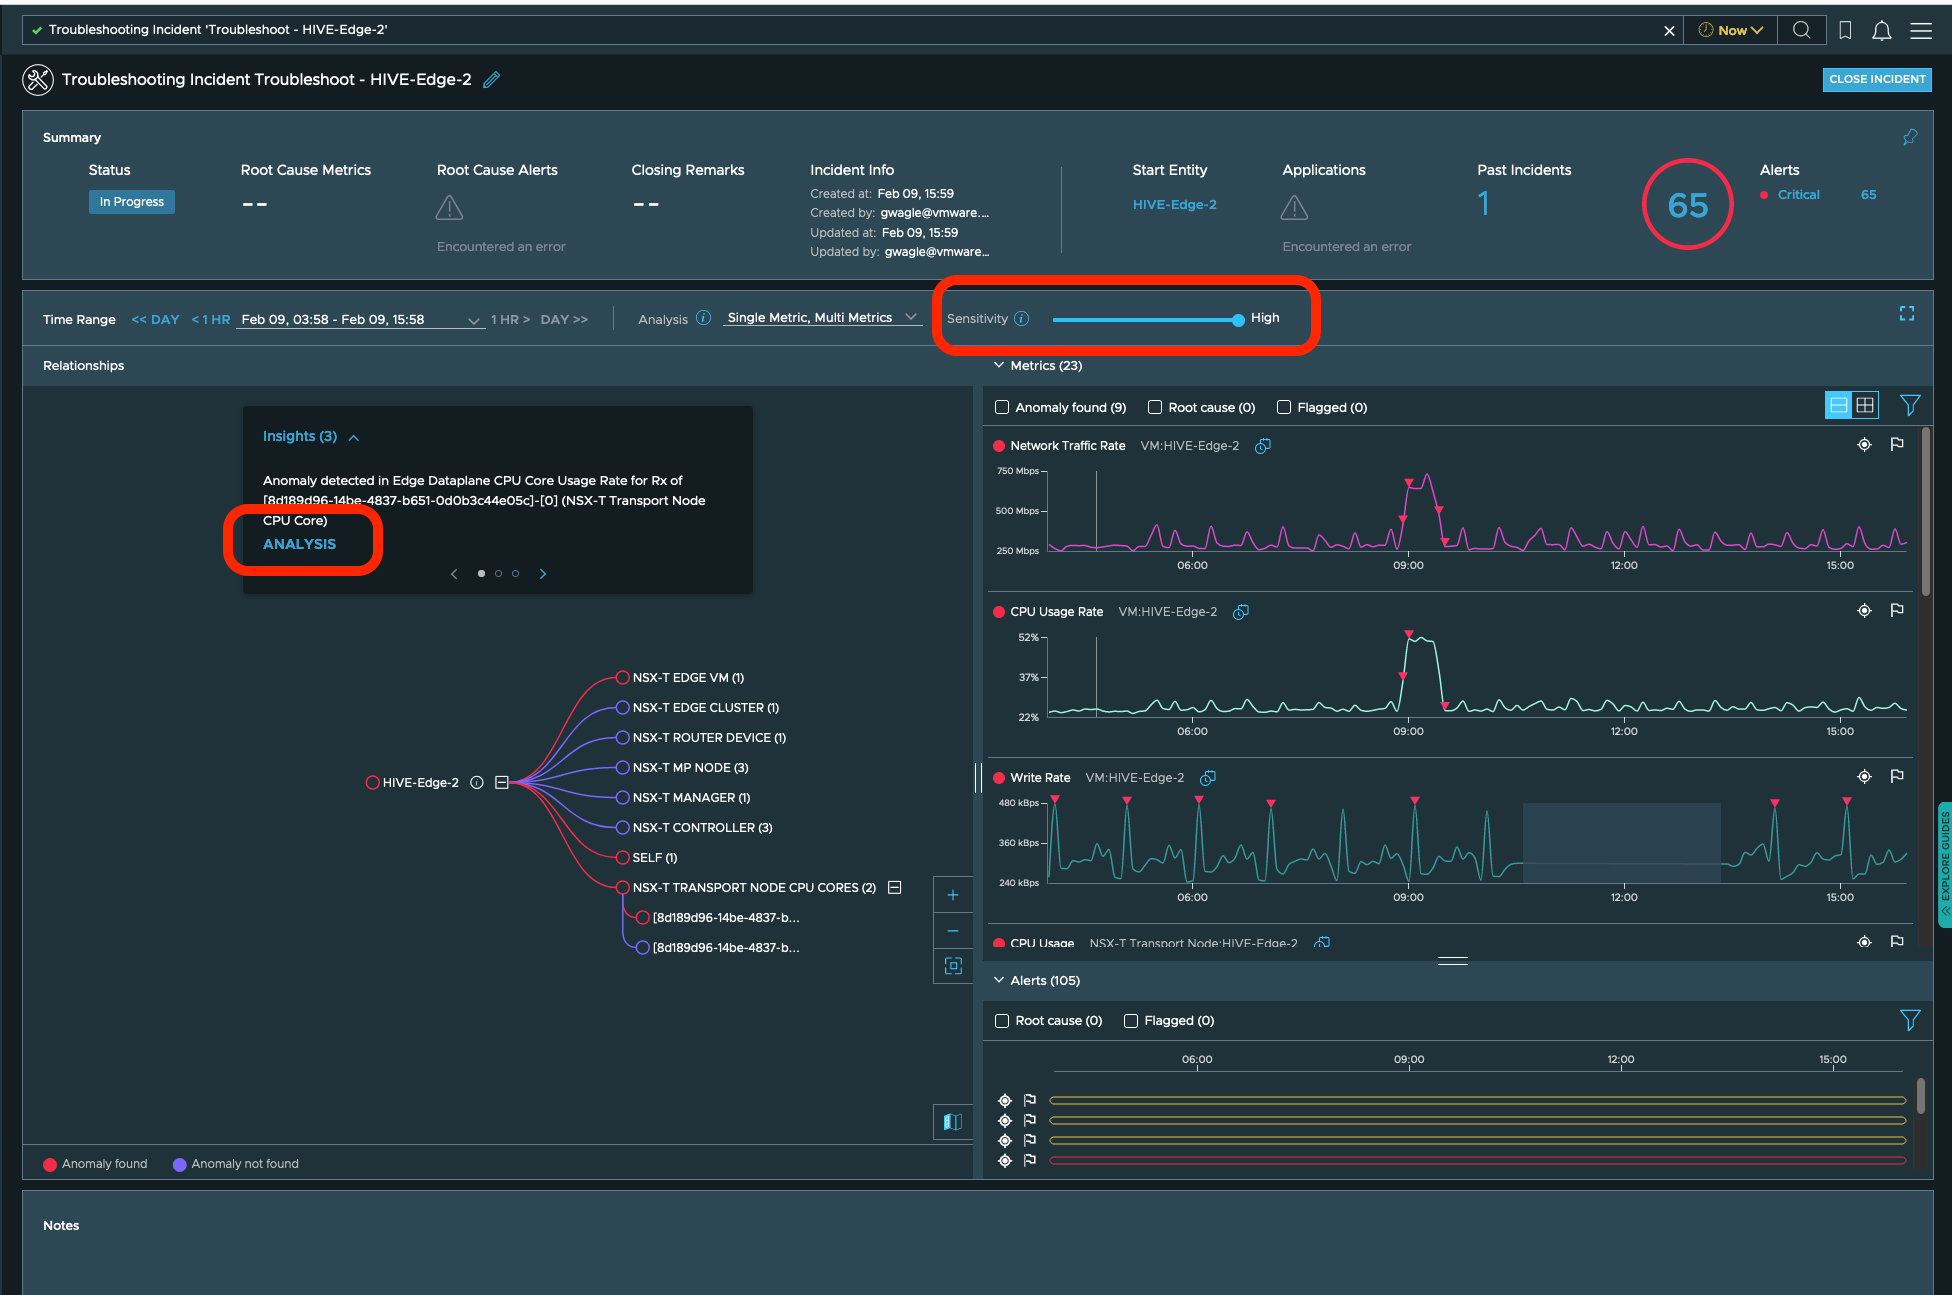
and that should take them to a troubleshooting dashboard like seen here:
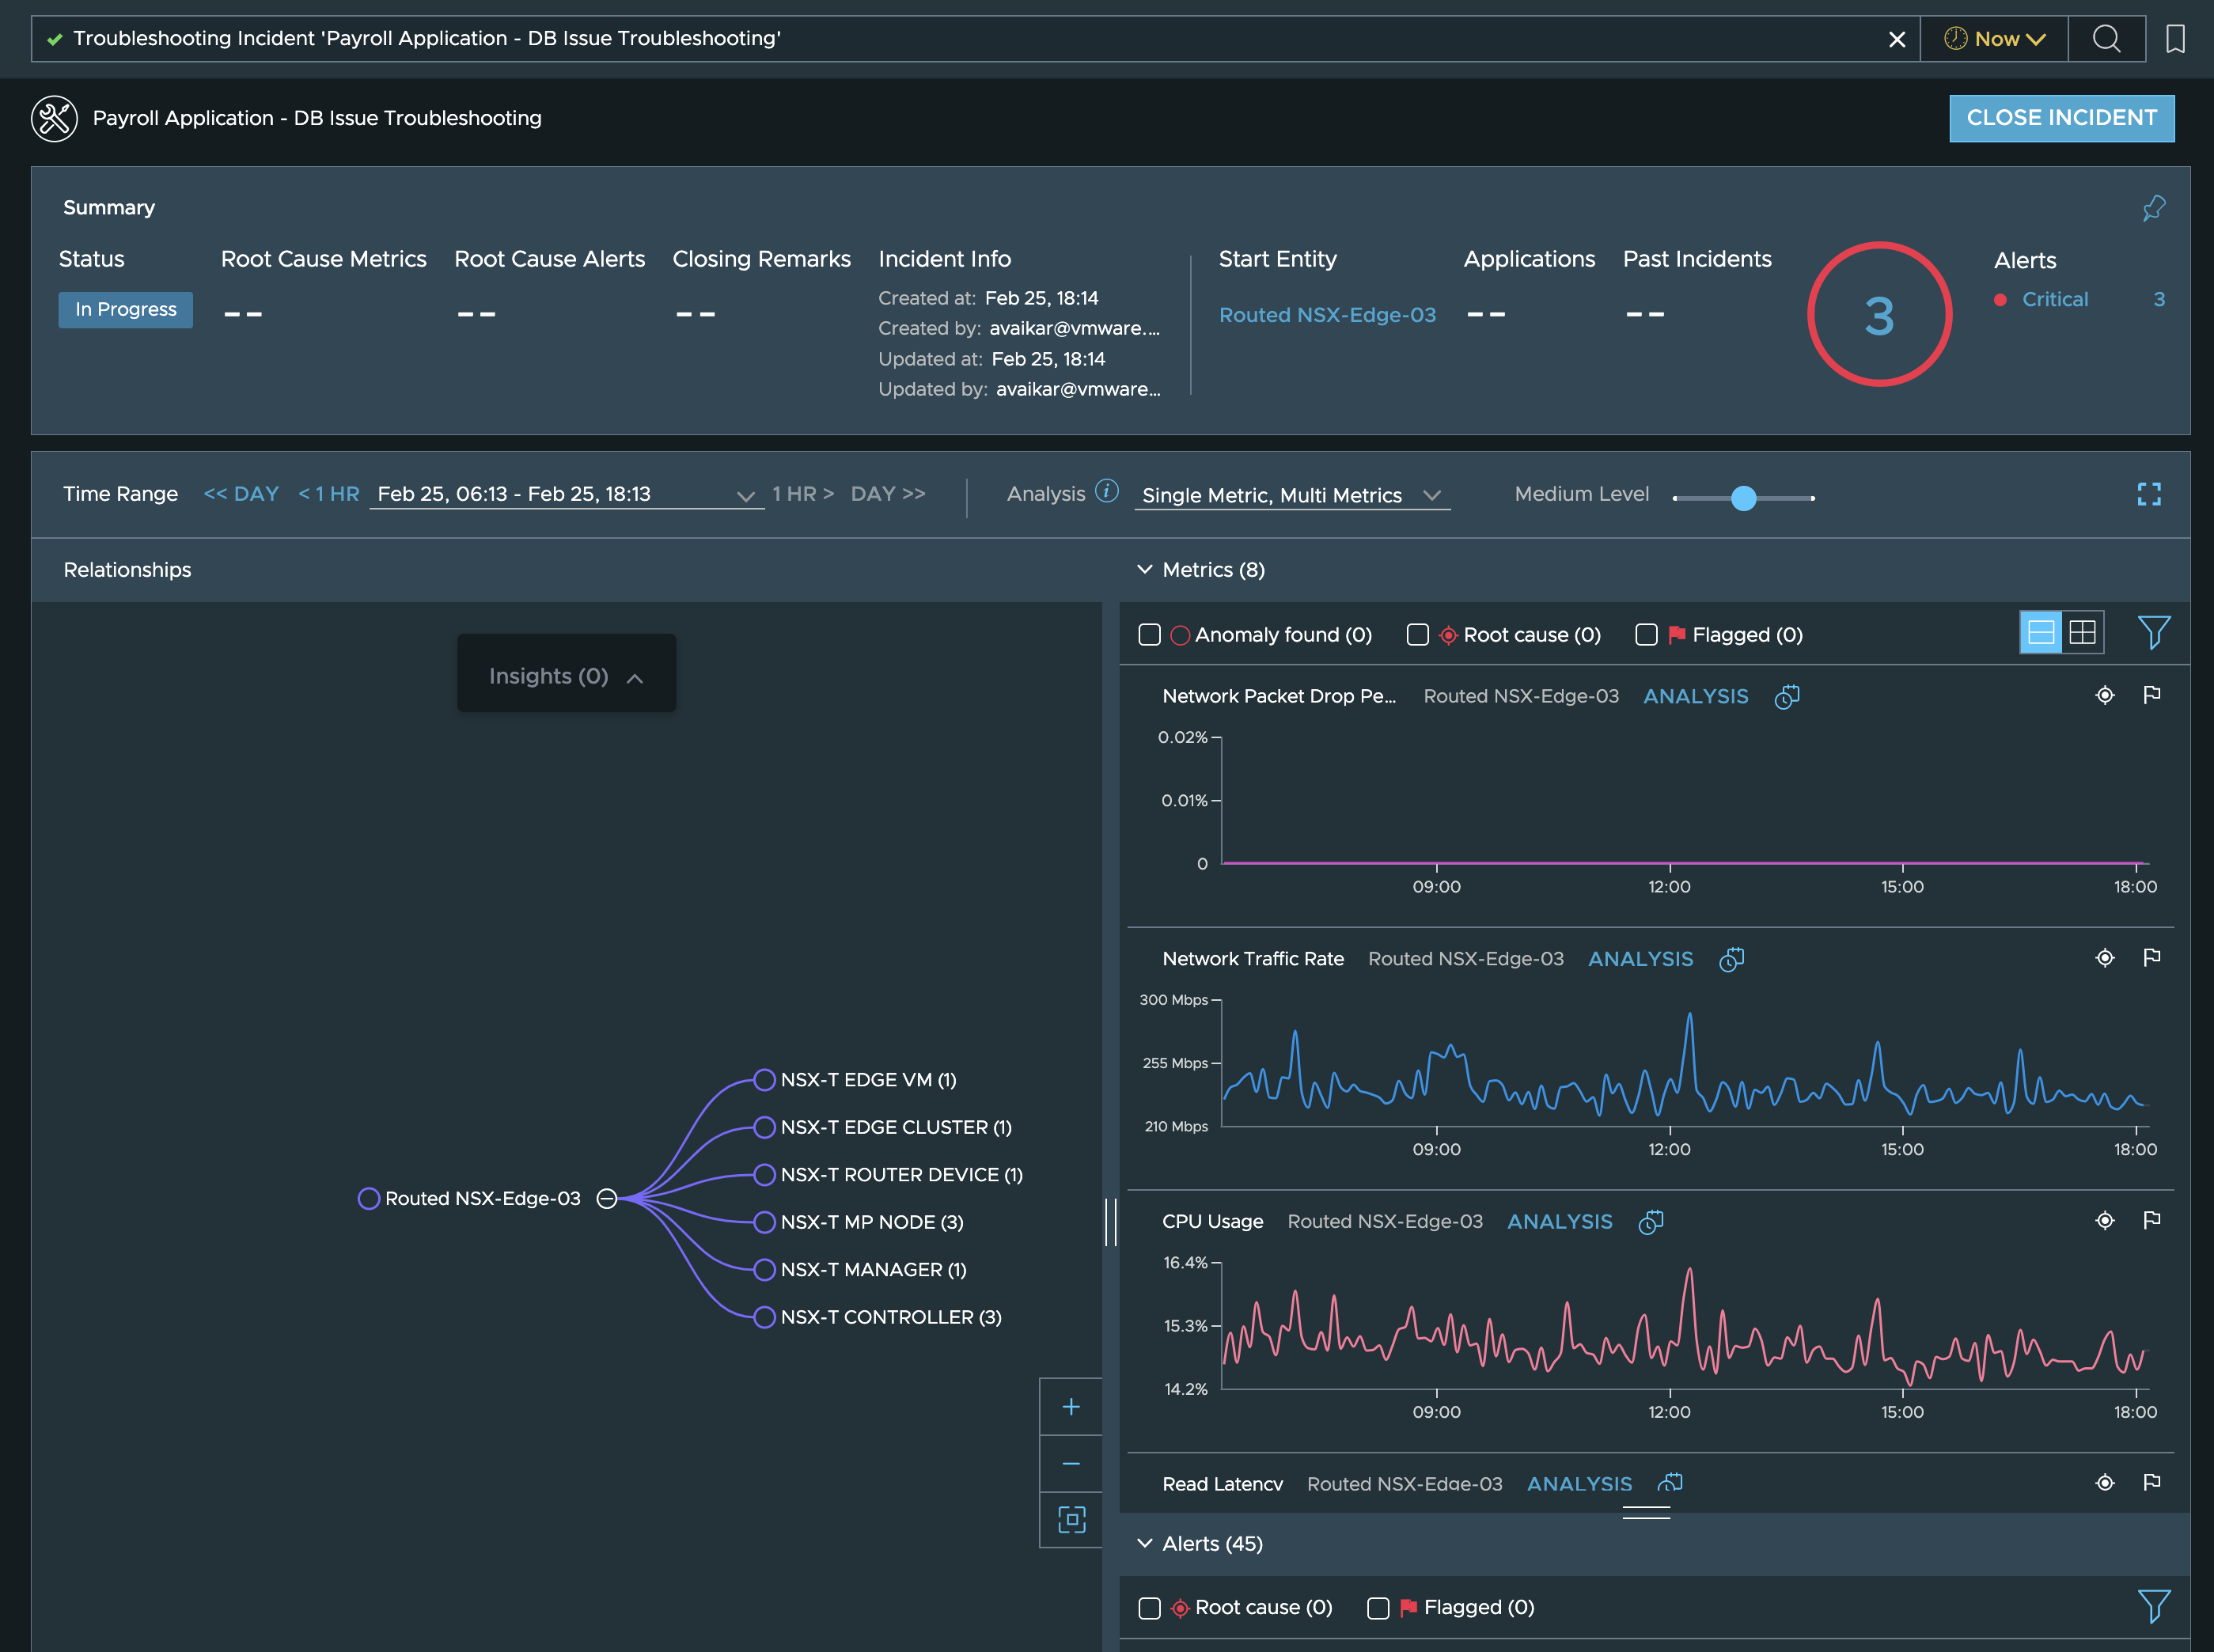
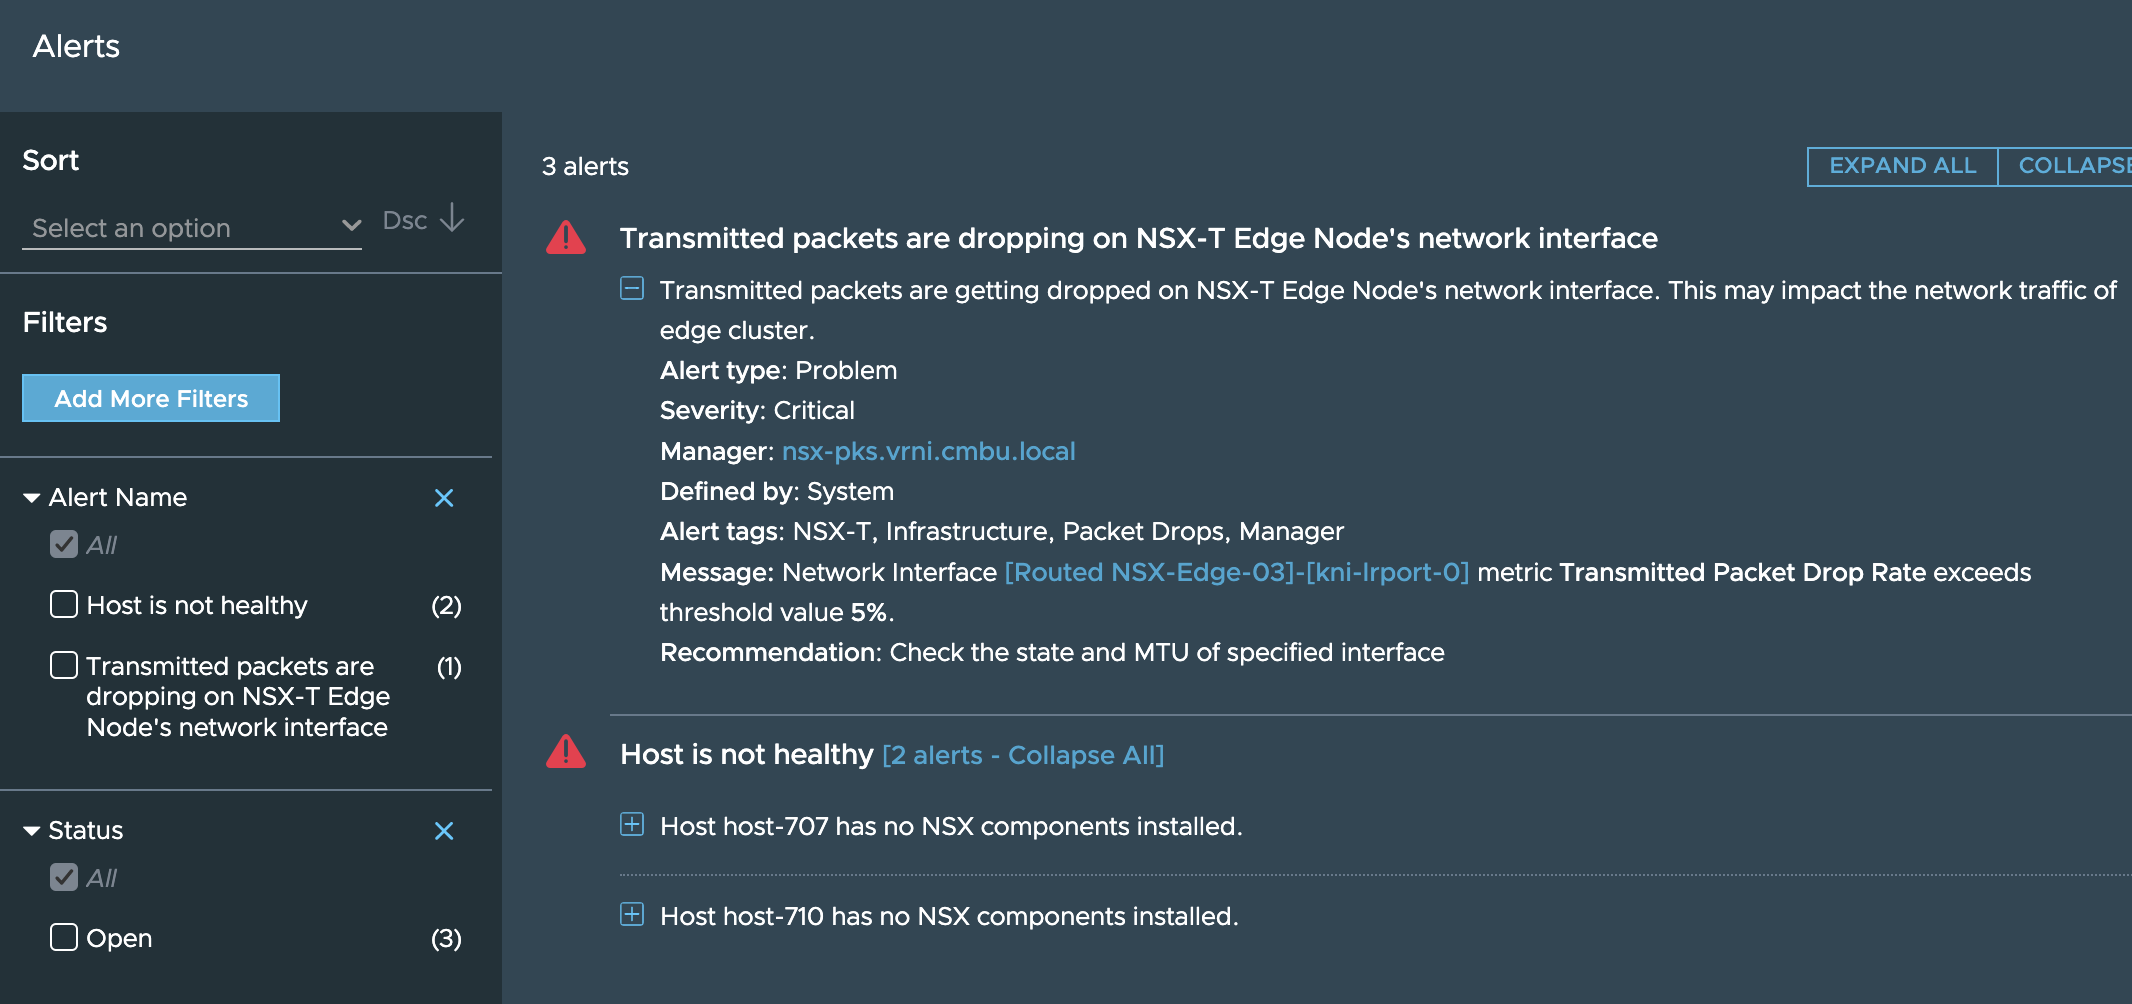
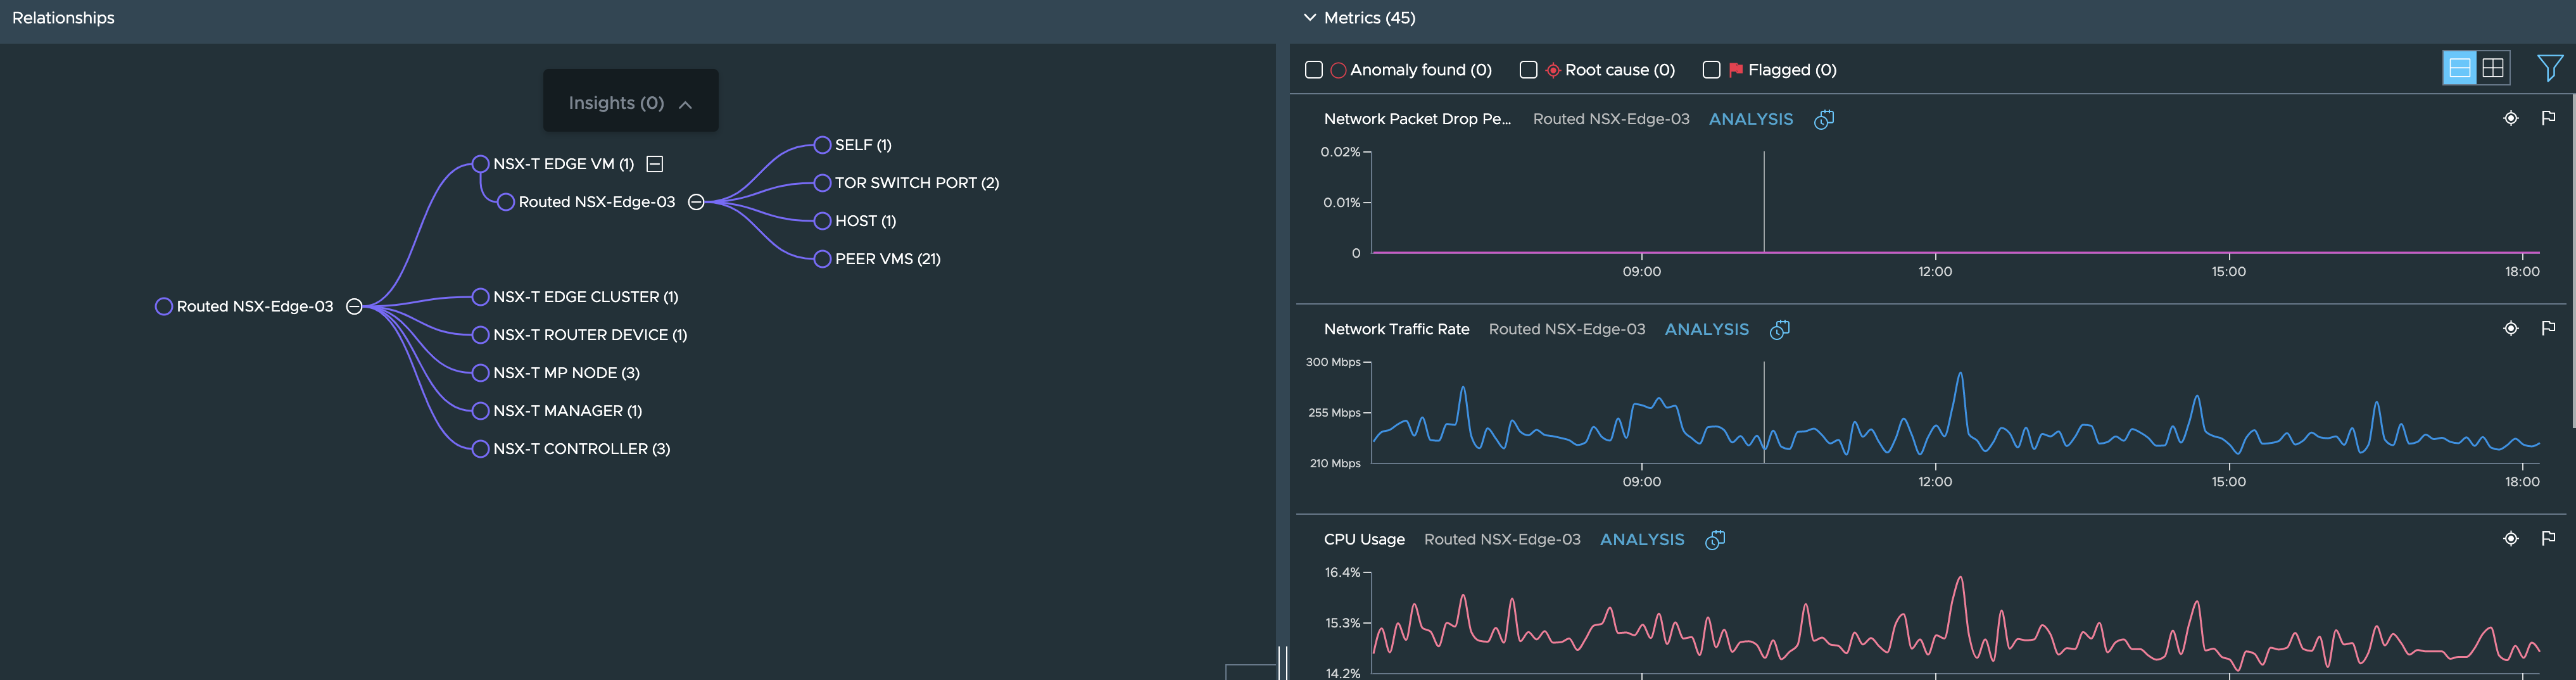
**Step 4**: On this dashboard we see the alerts associated with the ETN, ETN’s relationships to other entities and the metrics and outlier analysis for the metrics of the currently selected metric.
So first thing the user can do is check the alerts to ensure that there are no obvious issues with this ETN that vRNI has already found out about:
If there are no alerts worth investigating, then the actual walk down the rabbit hole starts where the user’s domain knowledge combined with the power of this troubleshooting tool will be put to test.
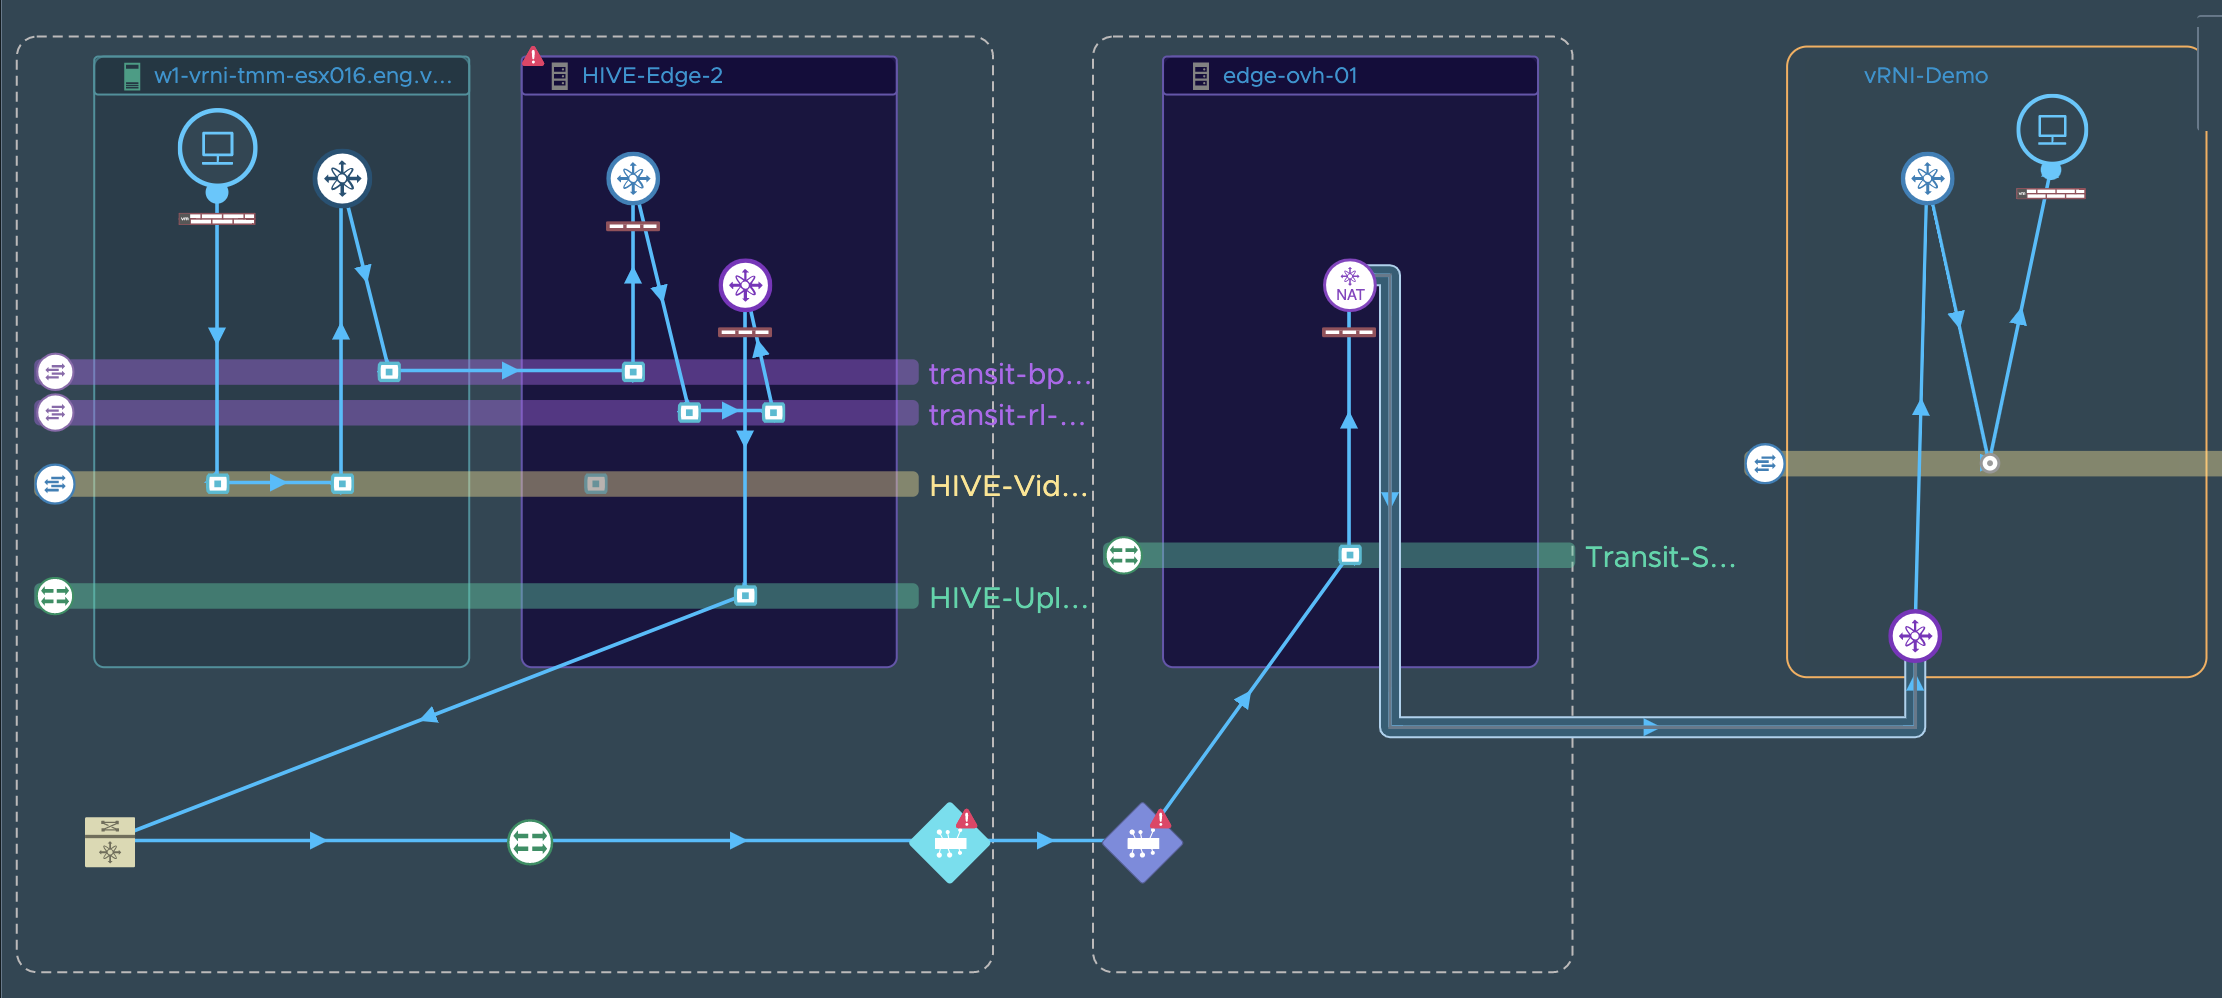
While the hierarchy of objects you need to investigate can quickly become complex like this:
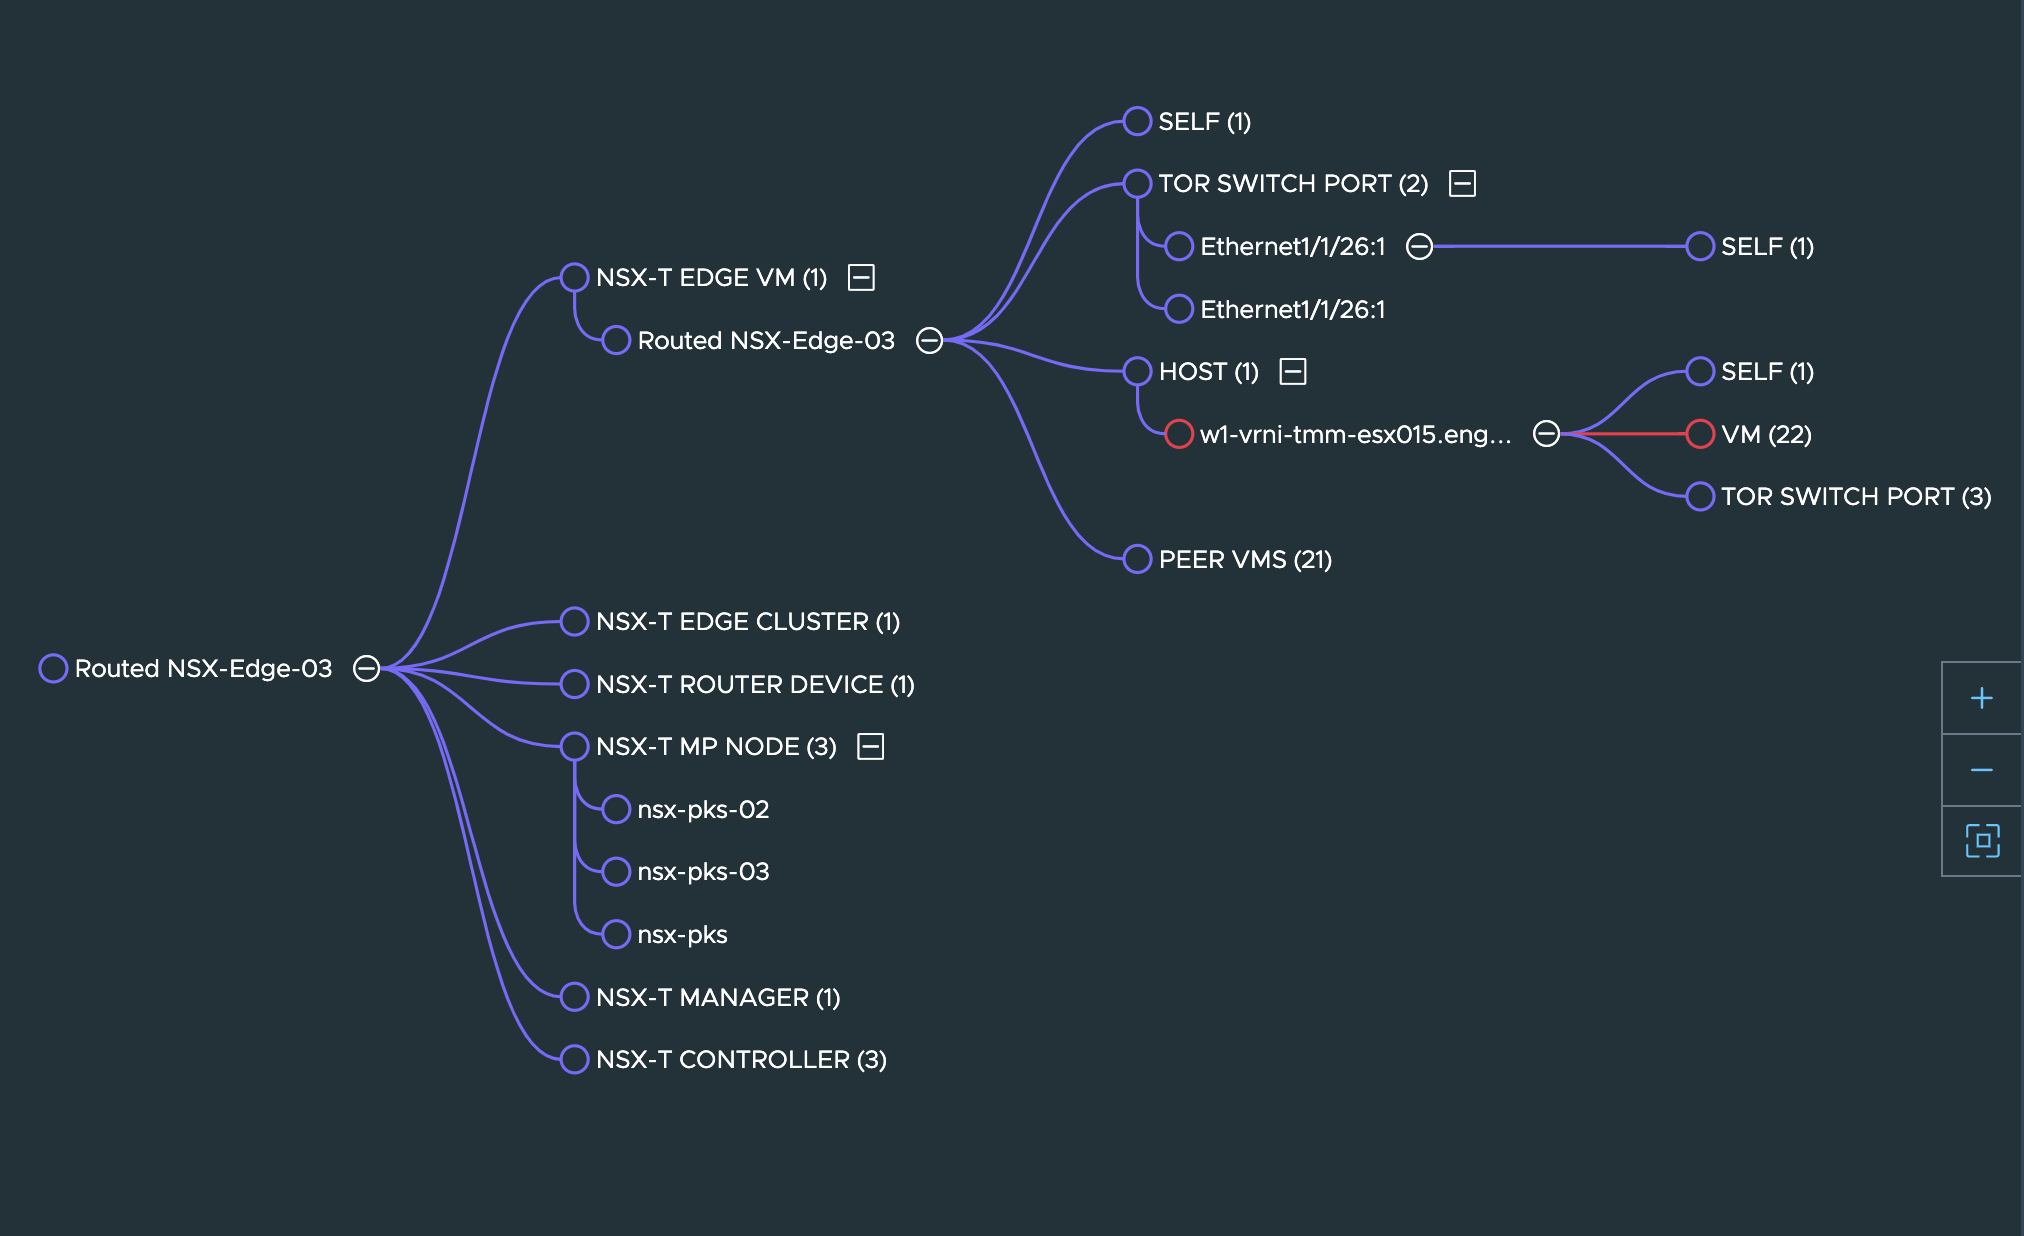
We recommend that any new user to explore this in a step by step manner.
Entities in the path that have alerts or anomalies associated with them will be indicated in red as shown in the graph above.
**Step 5**: For the current entity from the graph on the left panel, go through the metrics shown in the right panel and see if you see any unexpected/abnormal patterns of traffic
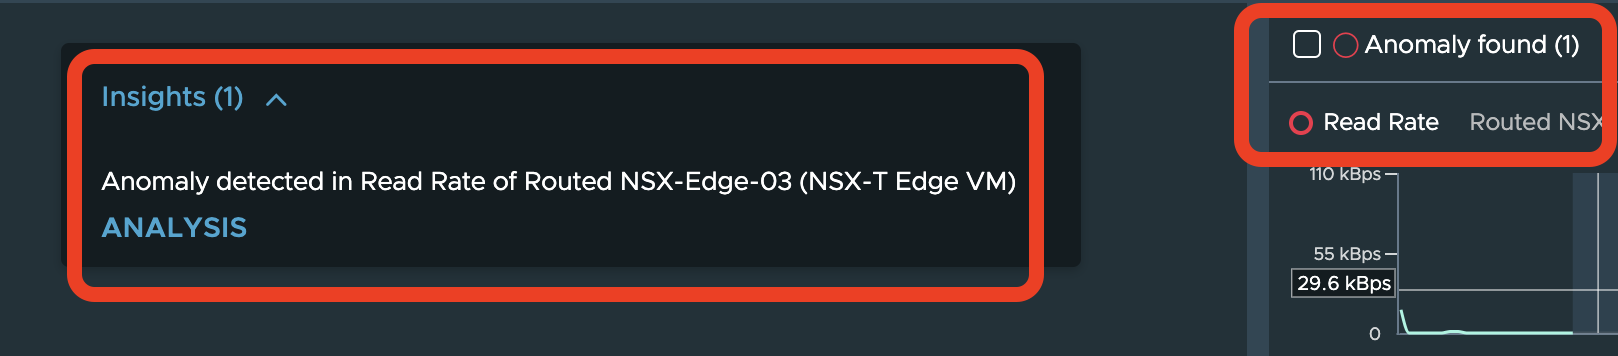
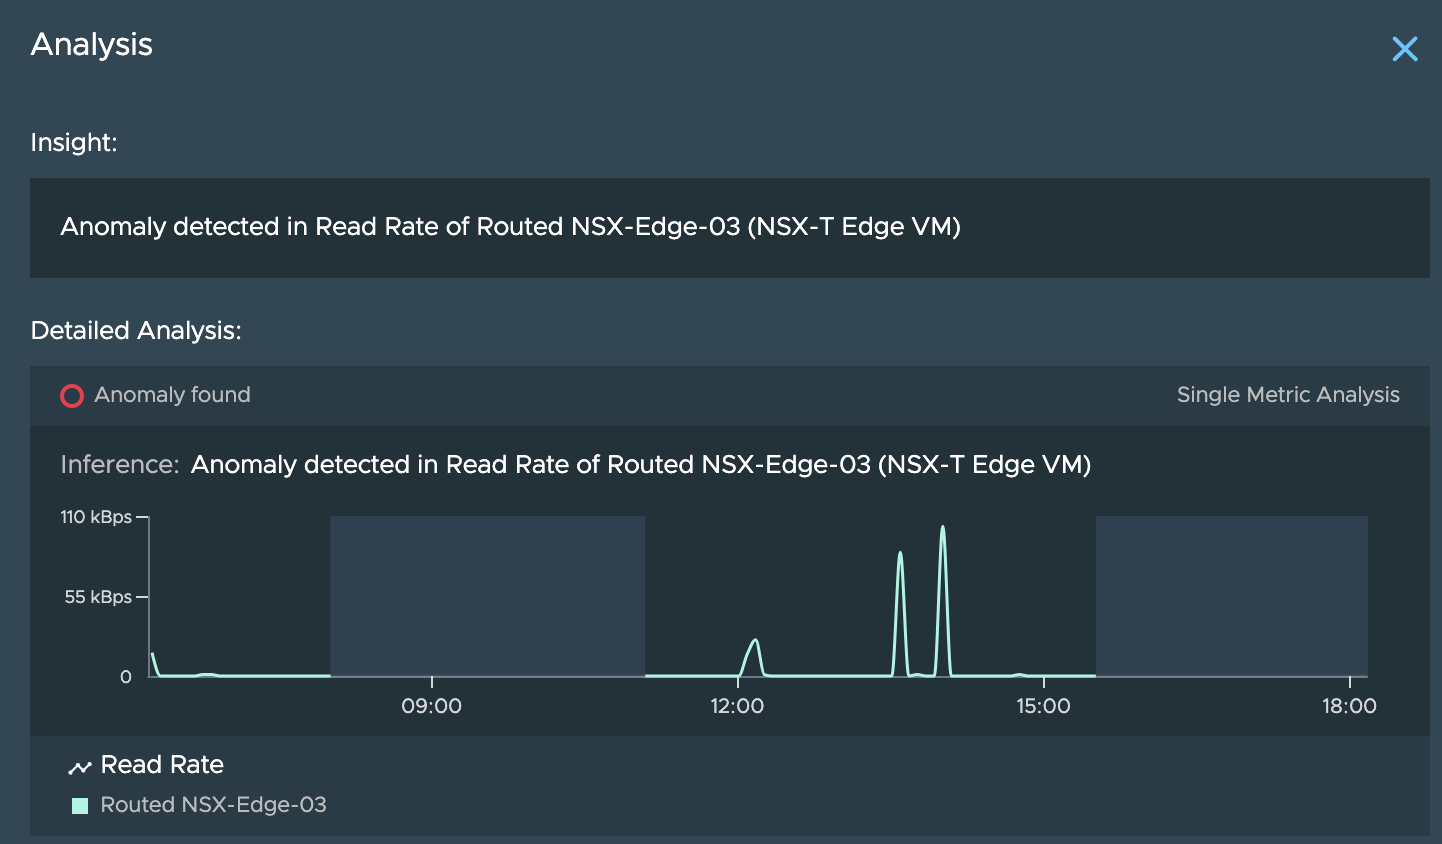
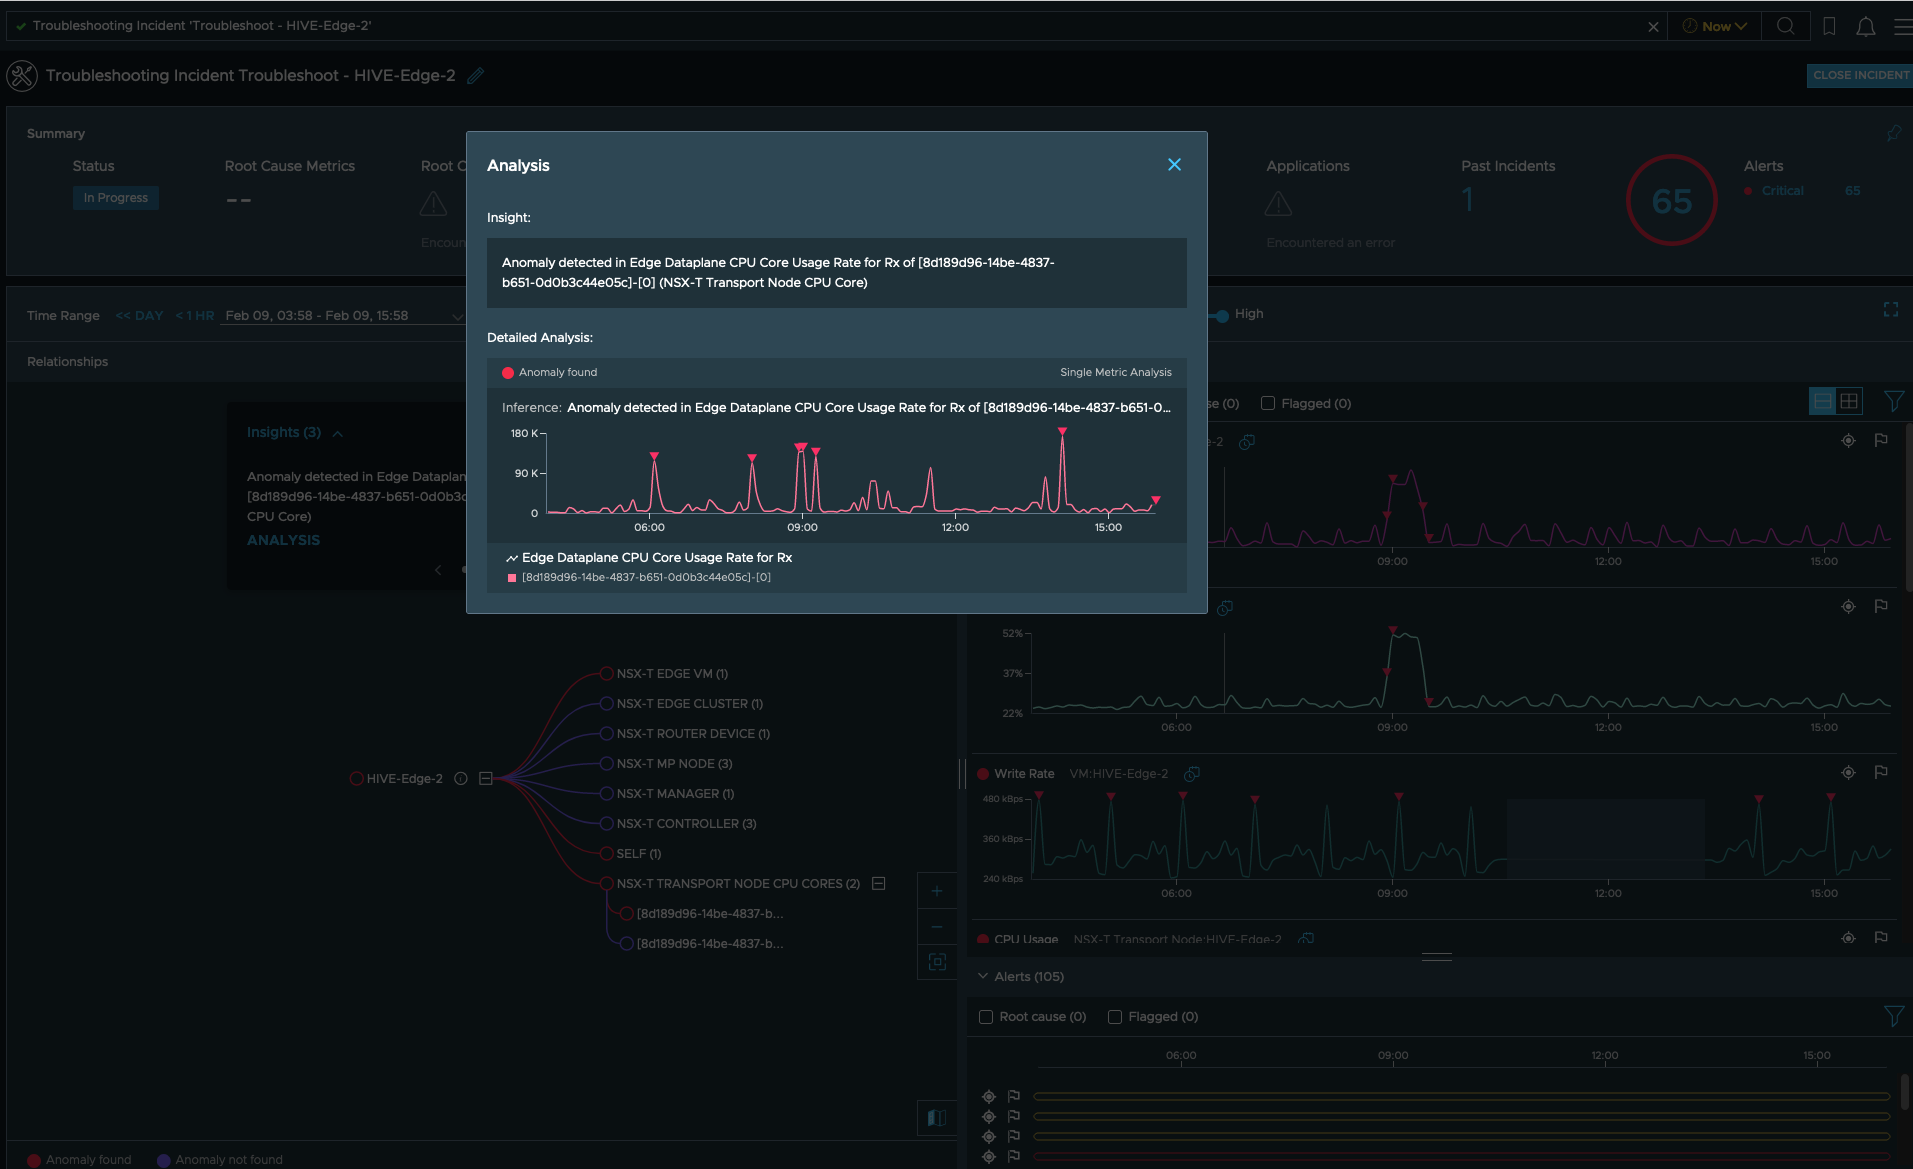
The job of spotting anomalies in the metrics is also carried out by vRNI and if vRNI has already found some anomalies, it will show up like this:
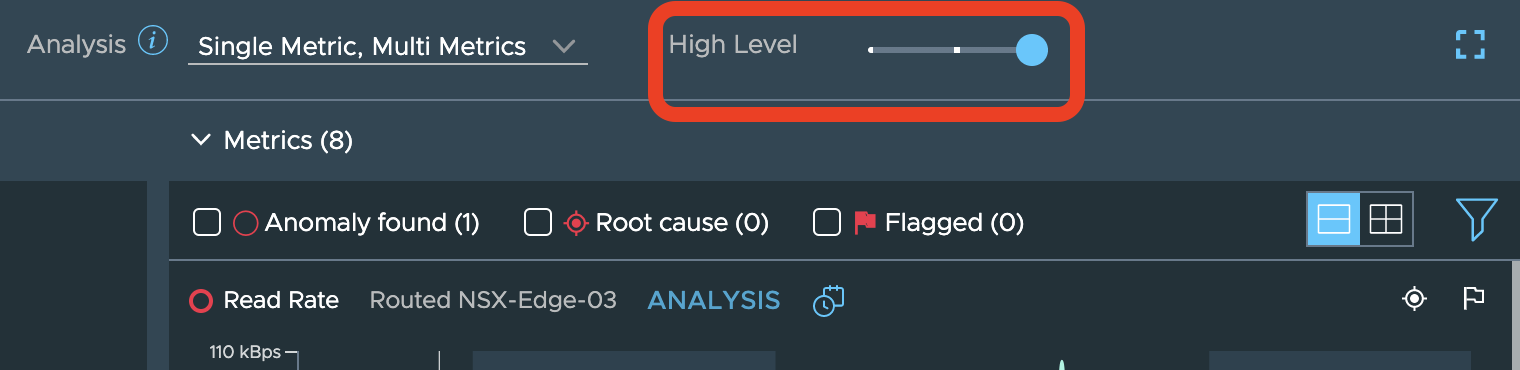
Note that the sensitivity of the anomaly detection engine is controllable via. a slider available on the same UI and depending on the pattern of the metric, increasing the sensitivity might help in troubleshooting difficult to catch problems:
For instance, in the above scenario, we see that vRNI has detected an anomaly in the read rate of the ETN. Clicking on the “Analysis” option seen in above screenshot shows you the details like these:
**Step 6**: Now let’s assume that the anomaly seen above is one-off case and the problem we see is consistent for a few days. So we can now dig deeper by switching to the ETN VM:
The ETN VM, its related entities and the metrics show up as seen here:
**Step 7**:
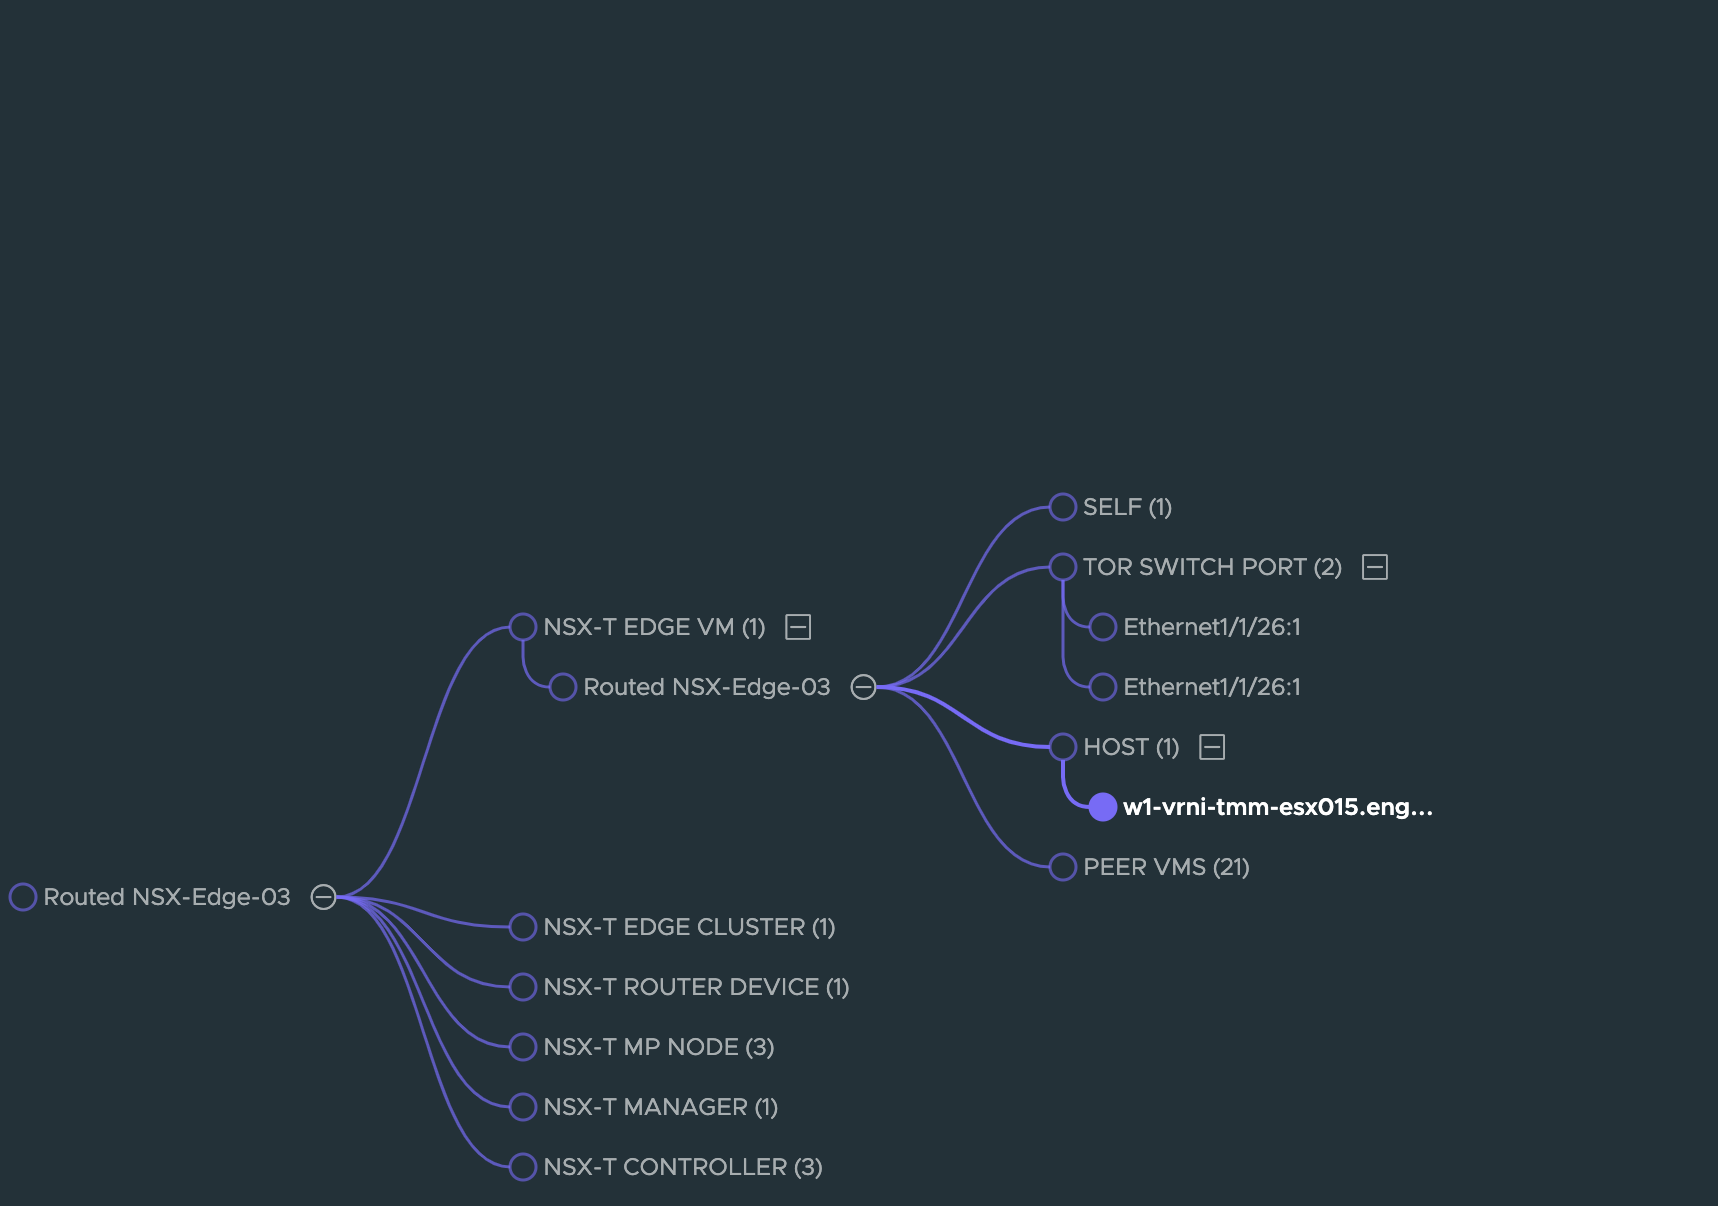
Continuing with this and assuming that everything seems fine at the ETN VM level, the next 2 logical things to check would be the host on which the ETN VM is running and the TOR Switch ports that the VM eventually uplinks to.
Checkin the host metrics, we see a big spike in CPU usage as well Network traffic rate on this host.:
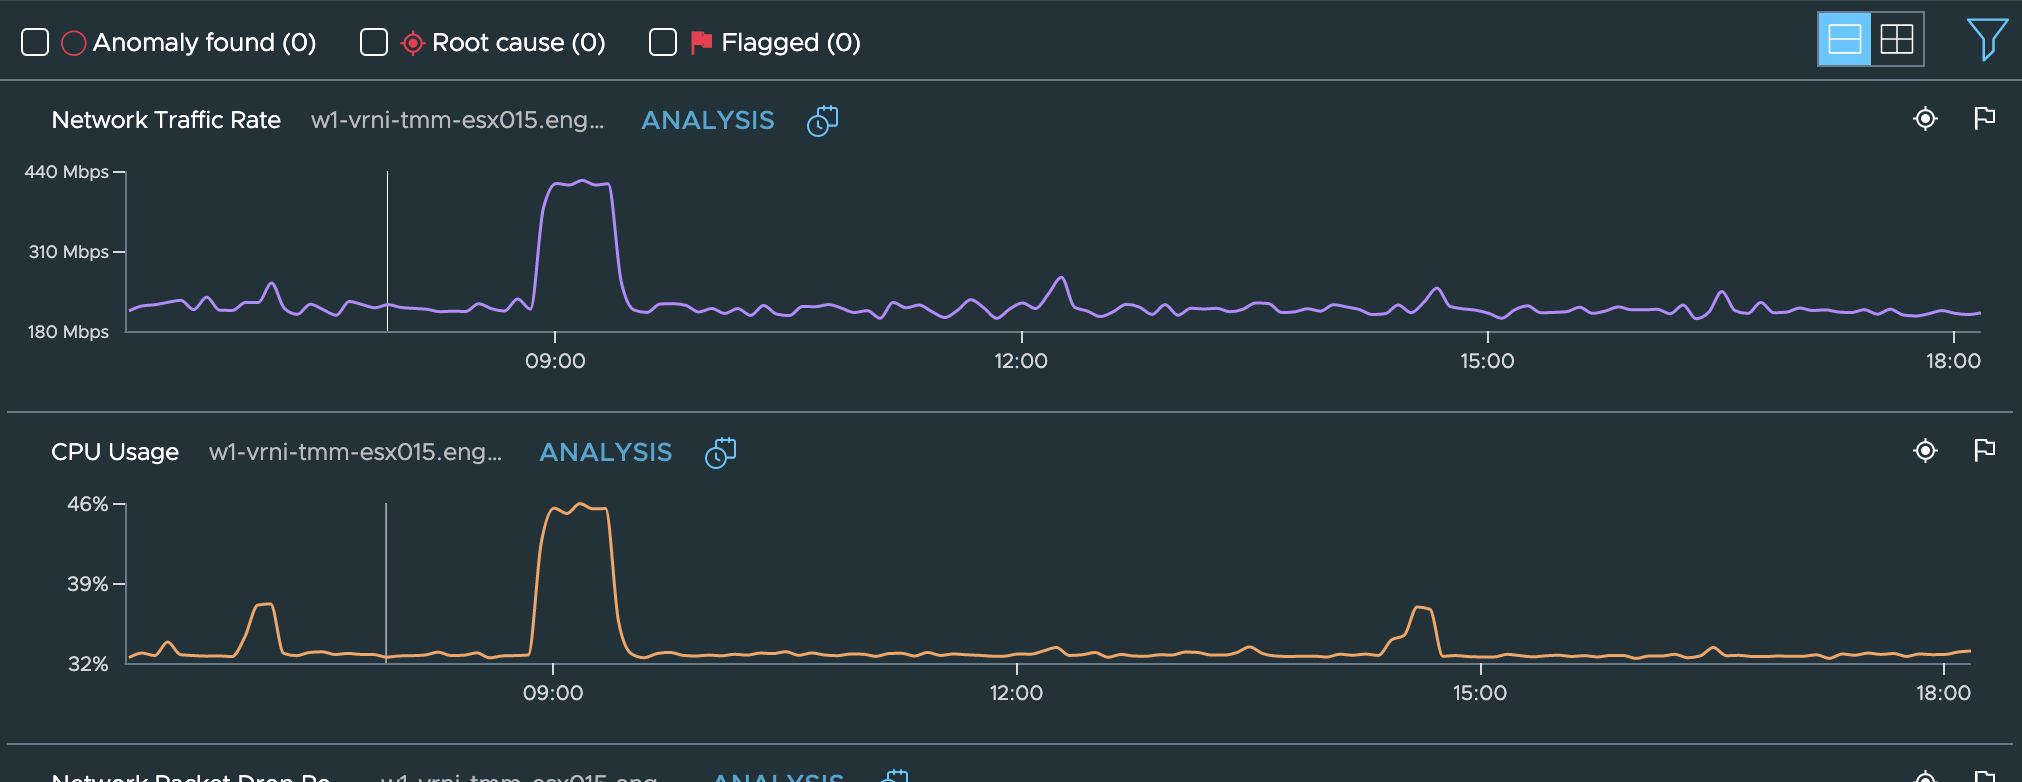
And if the problem reported by users was seen in this time range too, then we could conclude that the performance issue or intermittent failures seen in this time frame could be attributed to this overloading of CPU and/or network traffic.
A further analysis of network flows (if available) starting from the VMs on this host or the services and flows of the edge itself can be carried out:
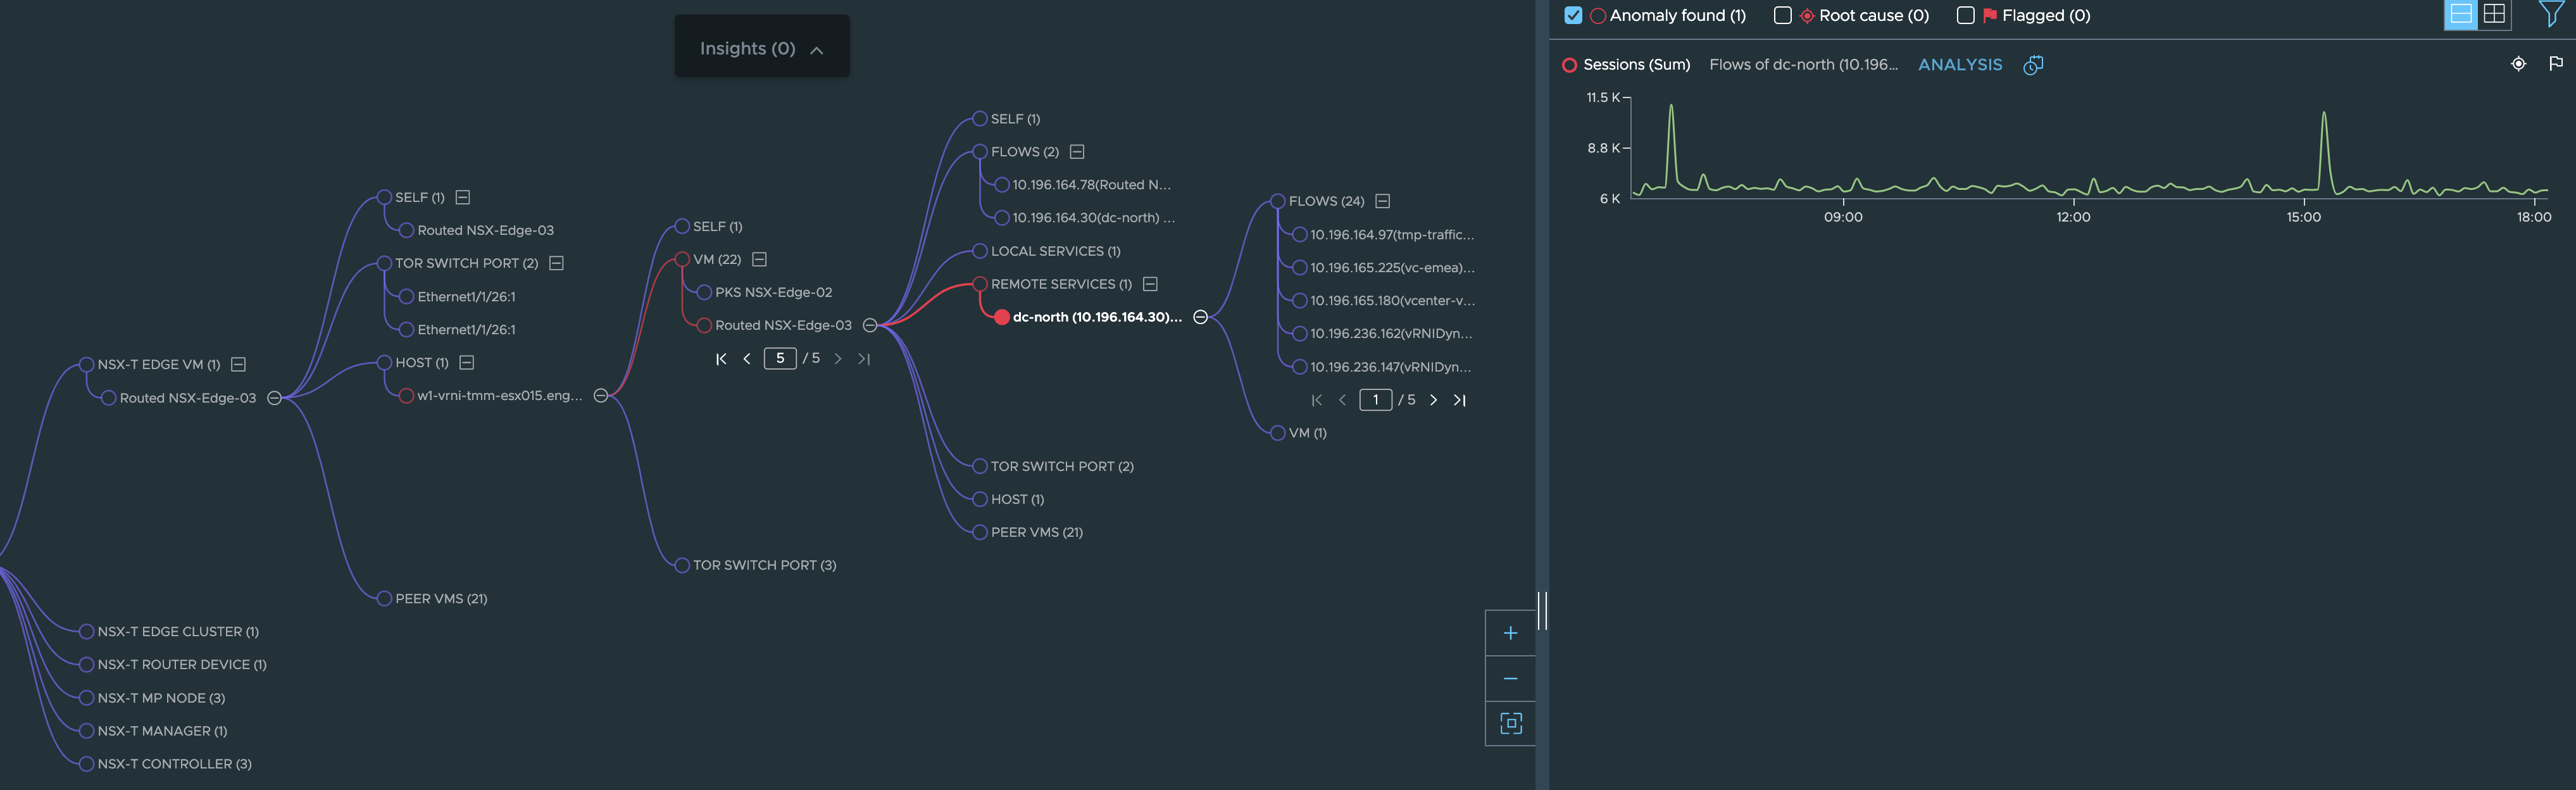
Or you can also continue with the investigation along the TOR Switch by following the TOR SWITCH PORT node seen in the above image
Note: If the path between source and destination is one of the critical paths from customers’ point of view, they could also configure a reachability intent for the source and destination so that an alert is raised if the path breaks down. That way they can do a proactive troubleshooting without having to wait for their users to encounter issues and then reach out with a ticket.
Scenario 2:
A customer is anticipating huge spike in traffic to their website/app (e.g. E-commerce giant is hosting a Flash Sale. Finale of a sport event)
Hence they would like to proactively monitor critical components of their environment while the event is going on.
Consider, this app is deployed in NSX-T DC, then network admin would like to monitor Edges which are hosting Tier0 router.
- Find Edges hosting Tier0 by finding the Edge cluster from vRNI.
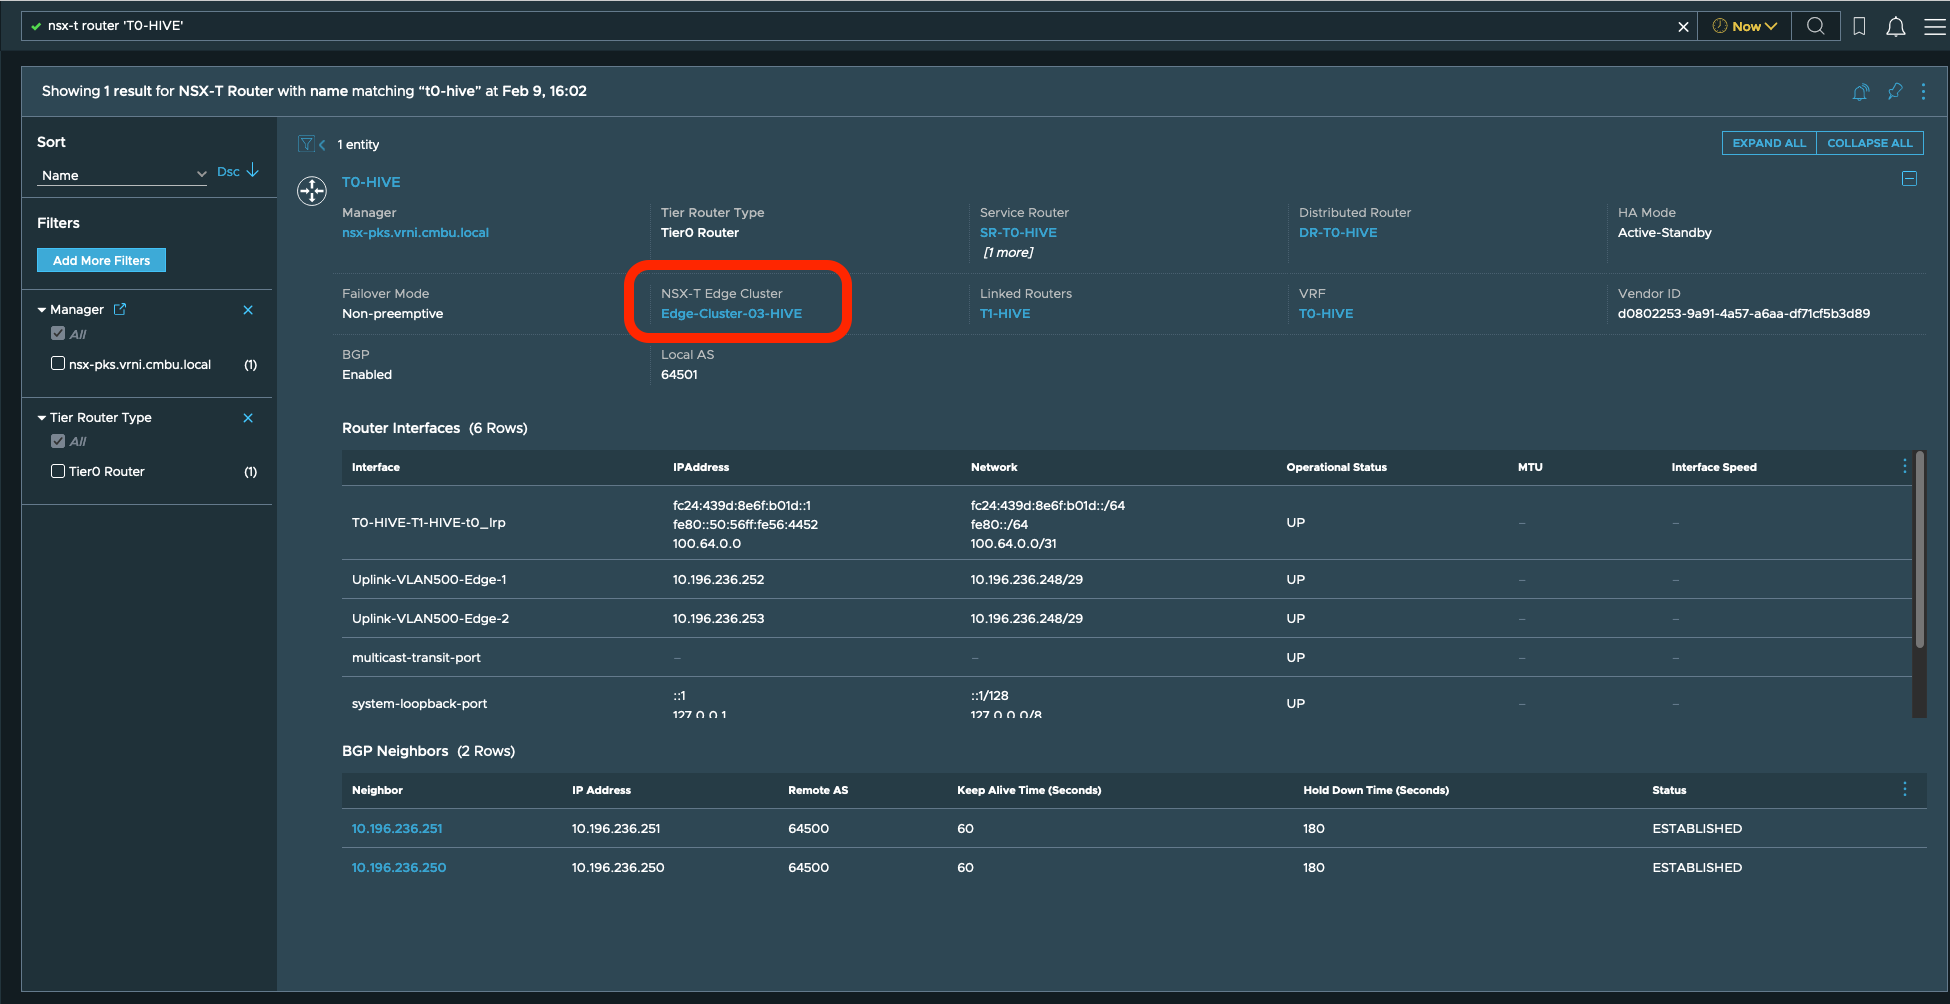
- Start a Troubleshooting Session for the edges
While at the troubleshooting page, user can adjust sensitivity.
They can look at an alerts or monitor anomalies presented out of the box.
** **
**
User can look into the insights and there analysis to find if system if any intervention is needed.
** **
**
Note: Troubleshoot page doesnt auto-refresh, user will have to refresh the page in-between to monitor the Edge node.