Leveraging change alerts for monitoring and troubleshooting
“Change is the only constant” is a common adage, but then it was Jeffrey Gitomer who got it right when he said, “Change is not a four-letter word…but often your reaction to it is!”.
As seen in outages at Facebook[1] and Azure[2] it has been seen time and again that changes introduce unforeseen problems. These changes could be carried out by a human or could be done via. some automated workflow or could be originating from some hardware/software failure.
For instance, an ethernet port that has been down for last 6 weeks is very less likely to be the root cause of a sudden outage/connectivity issue as compared to an ethernet port that flip-flopped in last 2 hours.
Further, any seasoned admin will be familiar with vague requests/tickets that claim something like “We are having issues in XYZ environment, everything was working fine till yesterday. Can you please check if something is wrong?”.
In scenarios like above, figuring out what has changed in the datacenter is a critical step in troubleshooting for a DCOps engineer.
But simply having access to a massive CMDB or time series database of datacenter configuration changes or operational metrics is not of much use if figuring out “what has changed” becomes a tedious operation involving writing code or complex queries requiring knowledge of the database/table structure and join operations.
This is where vRNI comes in.
vRNI polls the configuration from the data sources quite frequently. Owing to this, vRNI is “aware” of the changes in configuration that are happening on the datasources.
vRNI records these changes in two ways:
- Versions of an entity’s configuration - This helps you view the configuration of the entity at any given point in time (subject to the retention policy you’ve used for your vRNI setup)
- Configuration change alerts - This helps you get notified in case something of interest changes.
Let’s consider a couple of scenarios and see how the changes tracked by vRNI can be useful in troubleshooting. Please note that this blog covers just the tip of the iceberg in terms of the benefit of the changes tracked by vRNI, but we hope it should be enough to give you a basic idea from which you can further extrapolate.
**Scenario 1 - Troubleshooting**
User complaints that the communication between VM1 & VM2 from his application has become very slow, it was working fine an hour ago.
One of the ways an admin could troubleshoot this issue is:
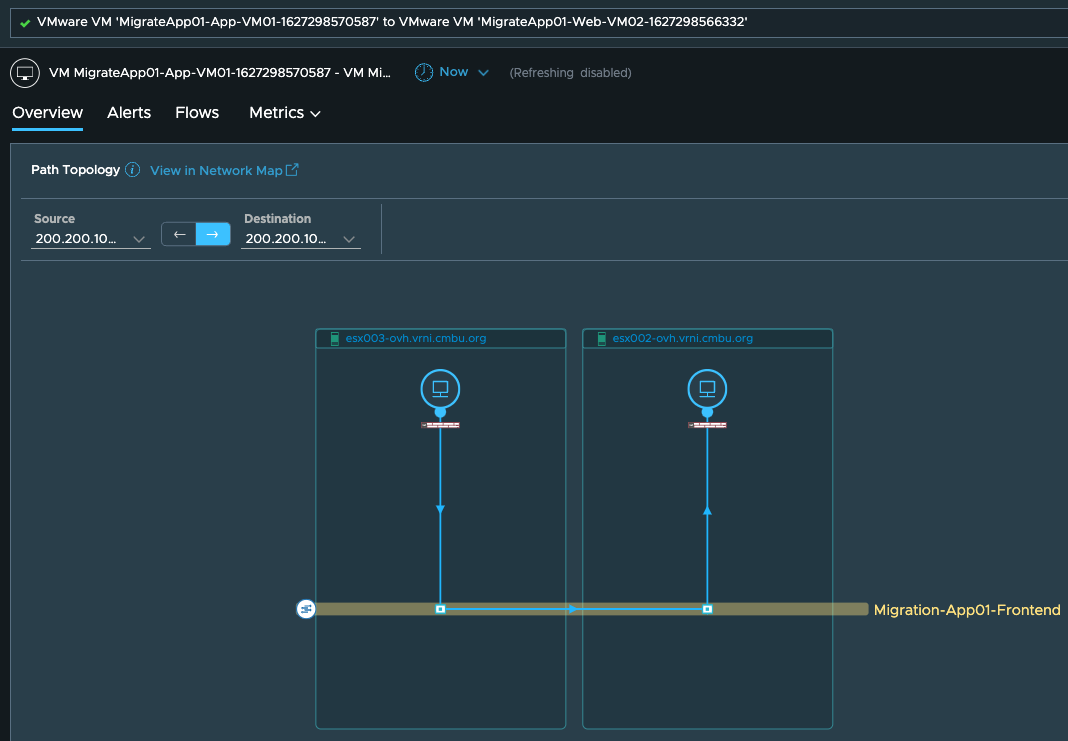
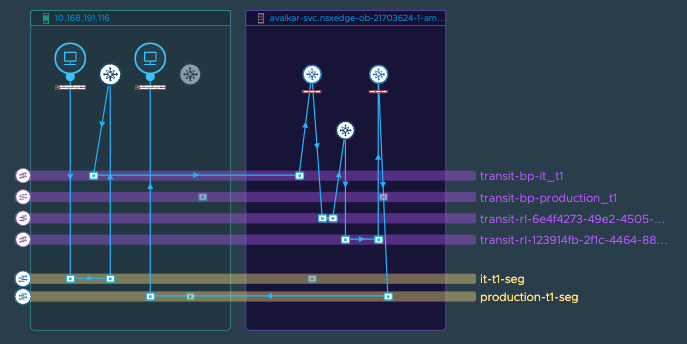
Step 1: Check out the VM to VM path for these two VMs in vRNI, say it
shows up like this:
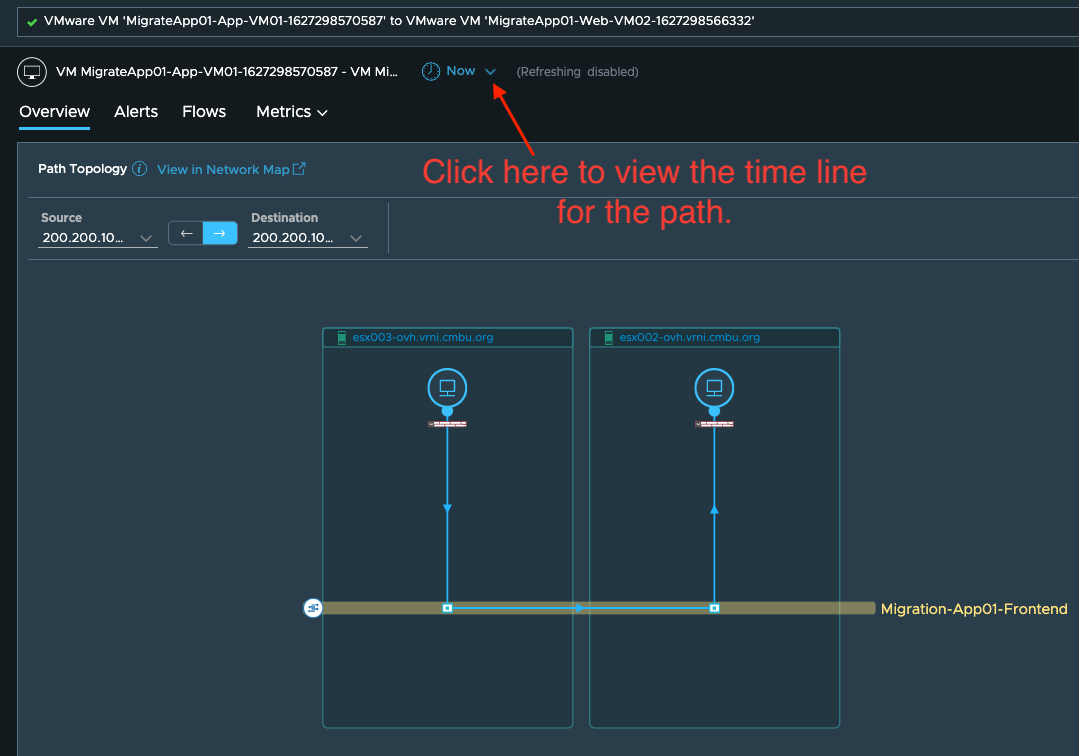
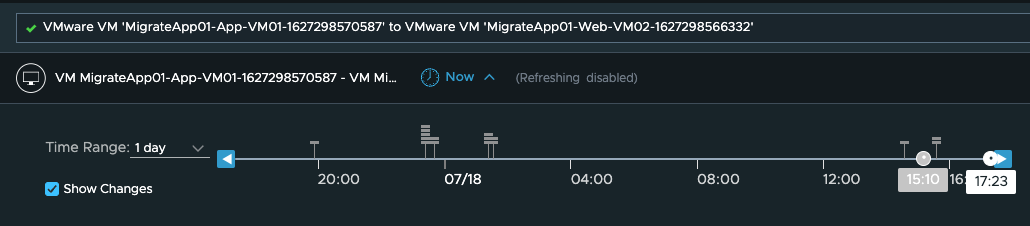
Step 2: Click on the “Now” drop down:
Step 3: You’ll see the ticks on the timeline indicating the changes that have happened in the entities associated with the VM
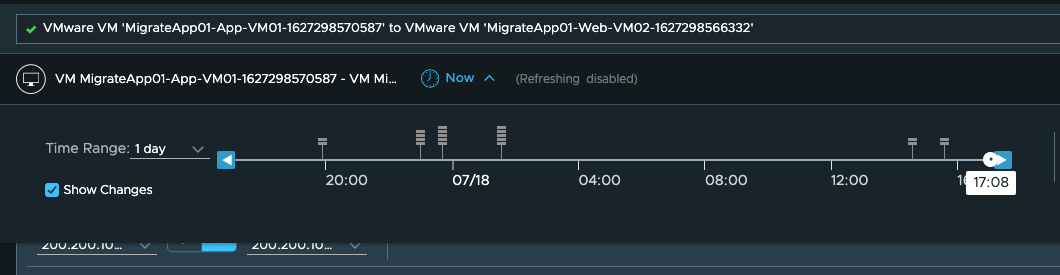
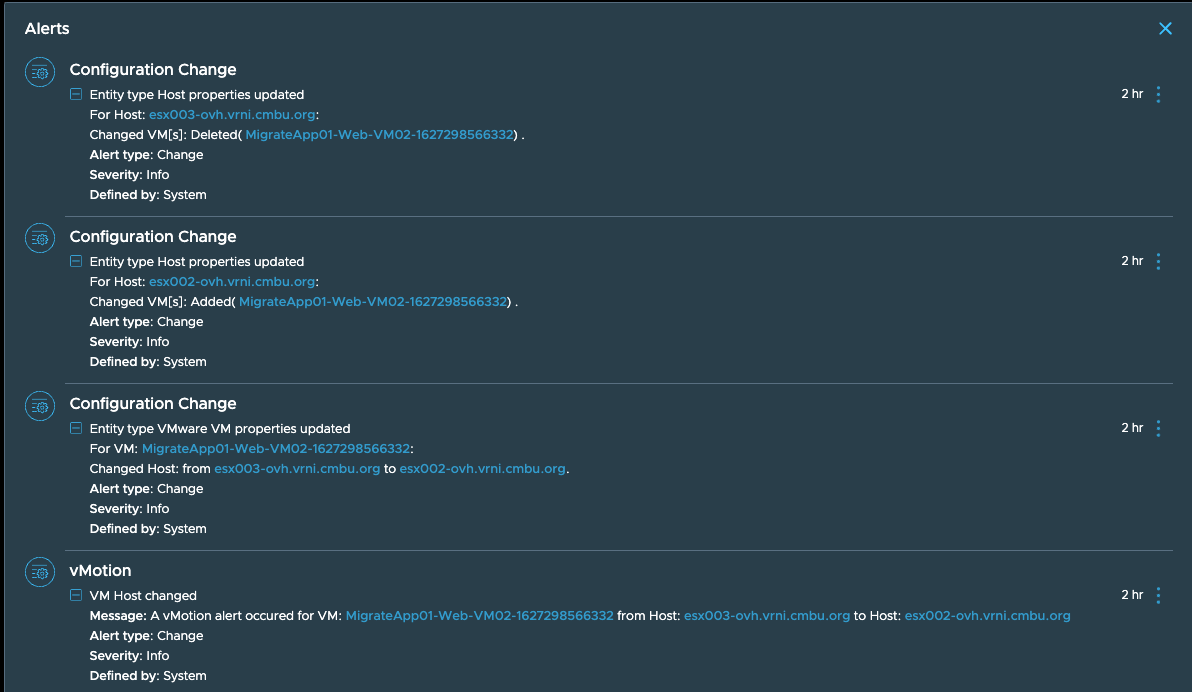
Step 4: If you click on the change ticks on extreme right on the timeline, you’ll see a list of latest config changes observed here
Step 5: On the timeline, select the point just before when the change was observed
Step 6: Once you go back in timeline, you see the VM to VM path show up like this
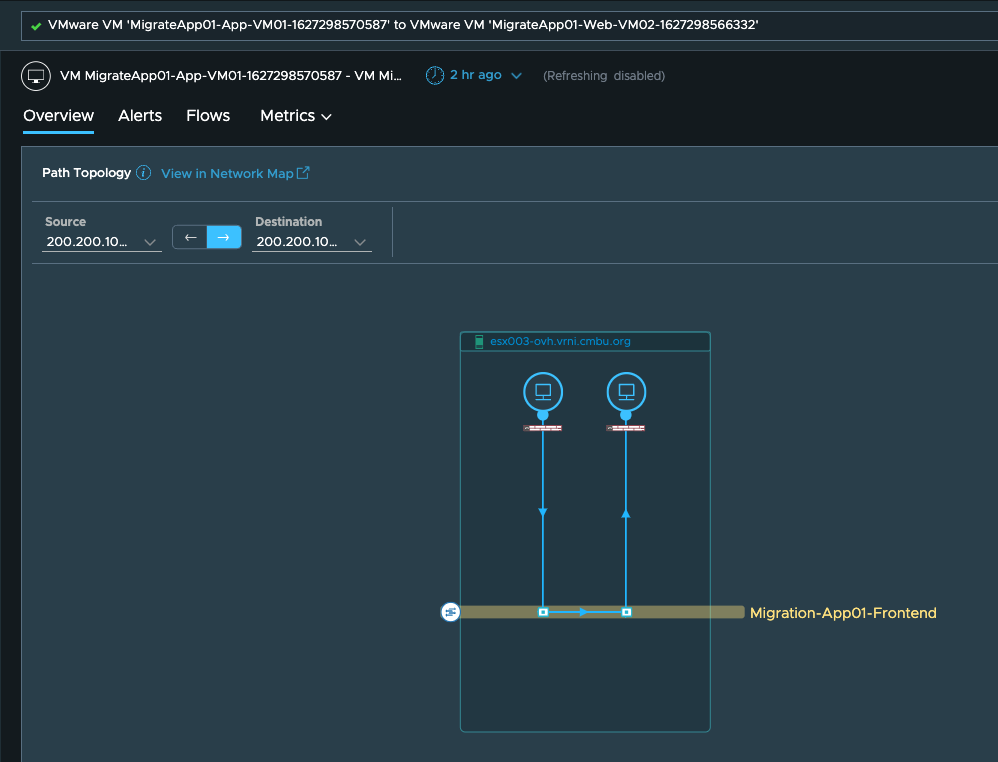
So here we see that the VMs were originally on the same host, so the communication between them would obviously be relatively faster than when the VMs got moved to different hosts. And this could explain the performance drop the users are observing on this setup and could be worth further investigation.
Here is a more real scenario that happened with a user:
Original path was:
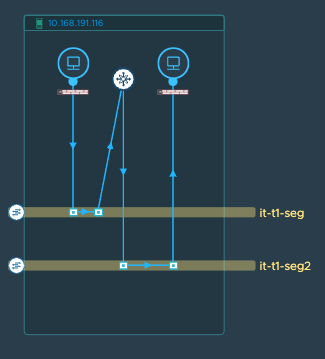
And after an accidental route change, the communication didn’t go down, but was severely impacted since the path changed to:
We were able to figure this issue with help of the changes seen in the environment over previous few days.
So if some of your common troubleshooting scenarios follow the logic
shown here:
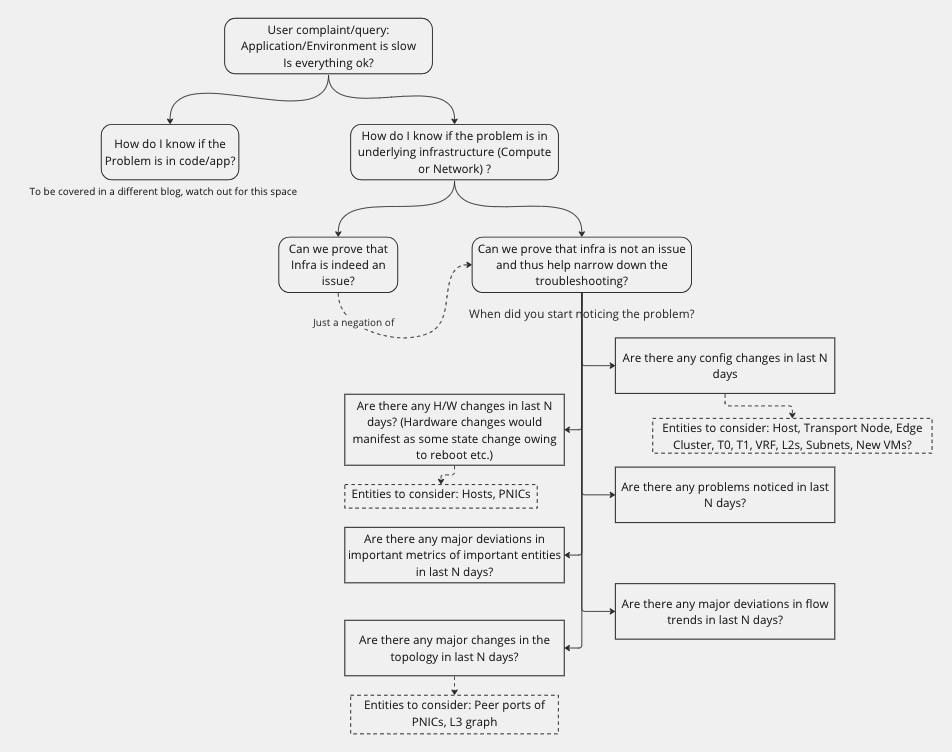
Then change tracking and change alerting carried out by vRNI can be a really powerful tool in your troubleshooting arsenal.
**Scenario 2 - Monitoring**
As mentioned earlier, vRNI also creates change alerts whenever it notices any changes in the entities.
These change alerts can be viewed in multiple places in vRNI UI, like entity dashboards, applications, search results etc.
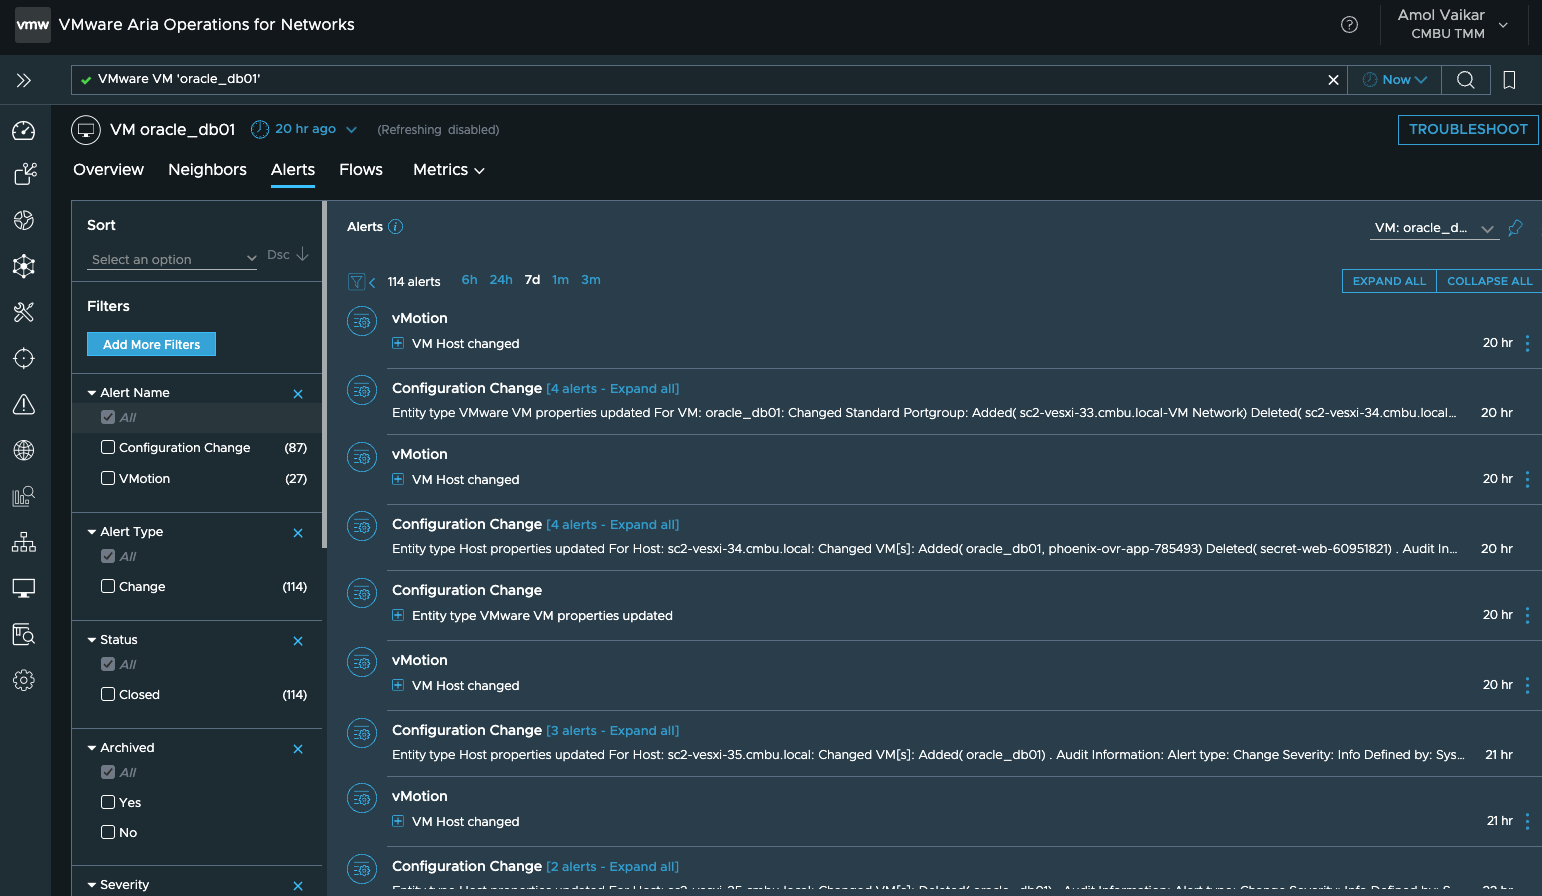
For instance, here we see all the changes that vRNI has observed for a particular virtual machine:
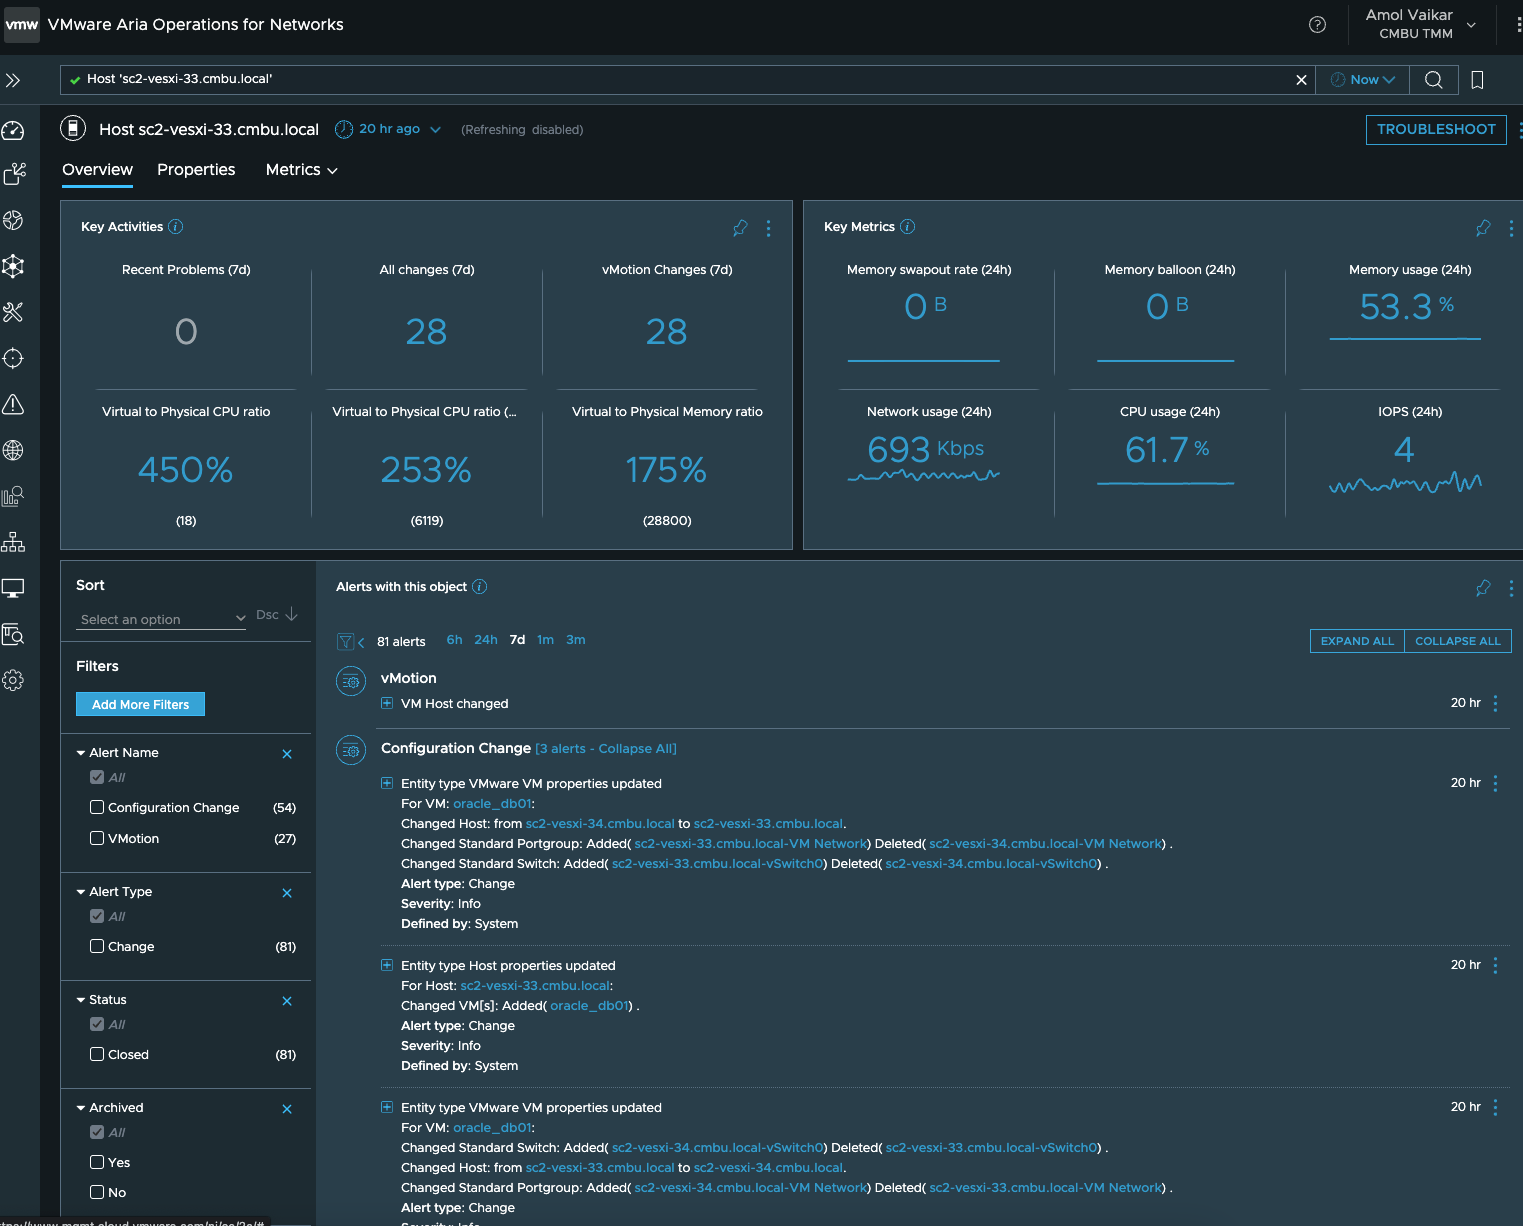
and an ESX host:
To view all the change alerts, one can use these entry points from the navigation menu on the left side in the vRNI UI:
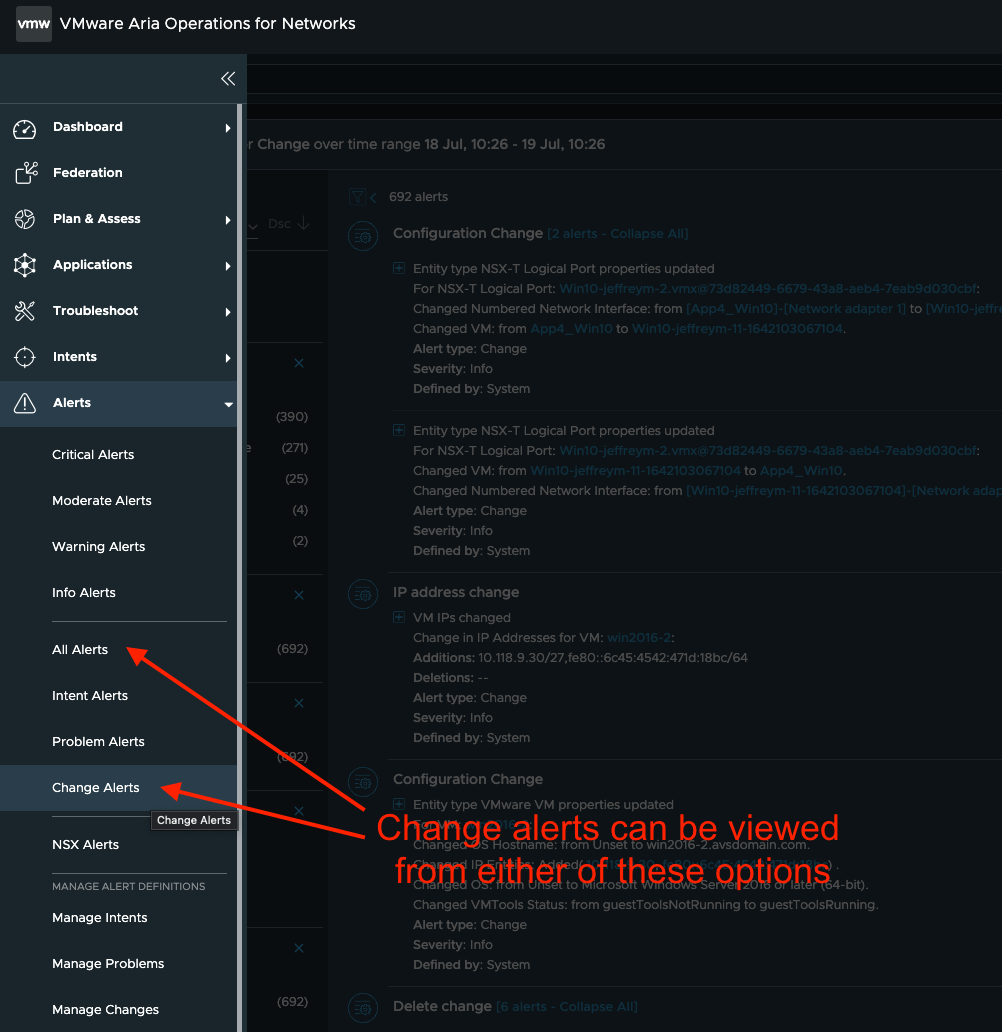
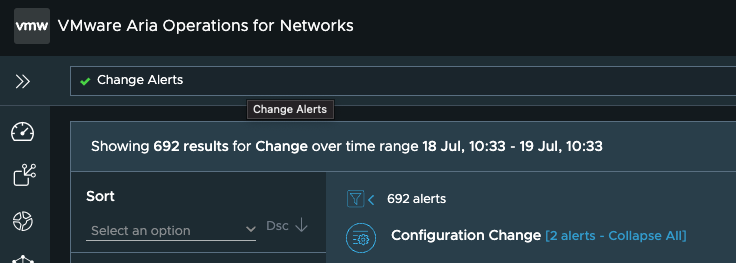
Or one can type in “Change Alerts” in the global search bar:
Like other alerts, you can subscribe for e-mail or snmp notifications on these change alerts, but be warned, that usually the volume of these change alerts can be very significant depending on how dynamic your environment it.
Considering the sheer number of change alerts that get generated in vRNI, it is obvious that you’d want to do some filtering in order to find the changes that are relevant to your monitoring/troubleshooting scenario.
For instance, on looking at the change alerts, one obvious question is, “what are all these changes happening in my environment?”
For that, you can execute a query like: “change alert group by message “
That should show the various types of changes that have happened in your environment in the last 24 hours, like this:
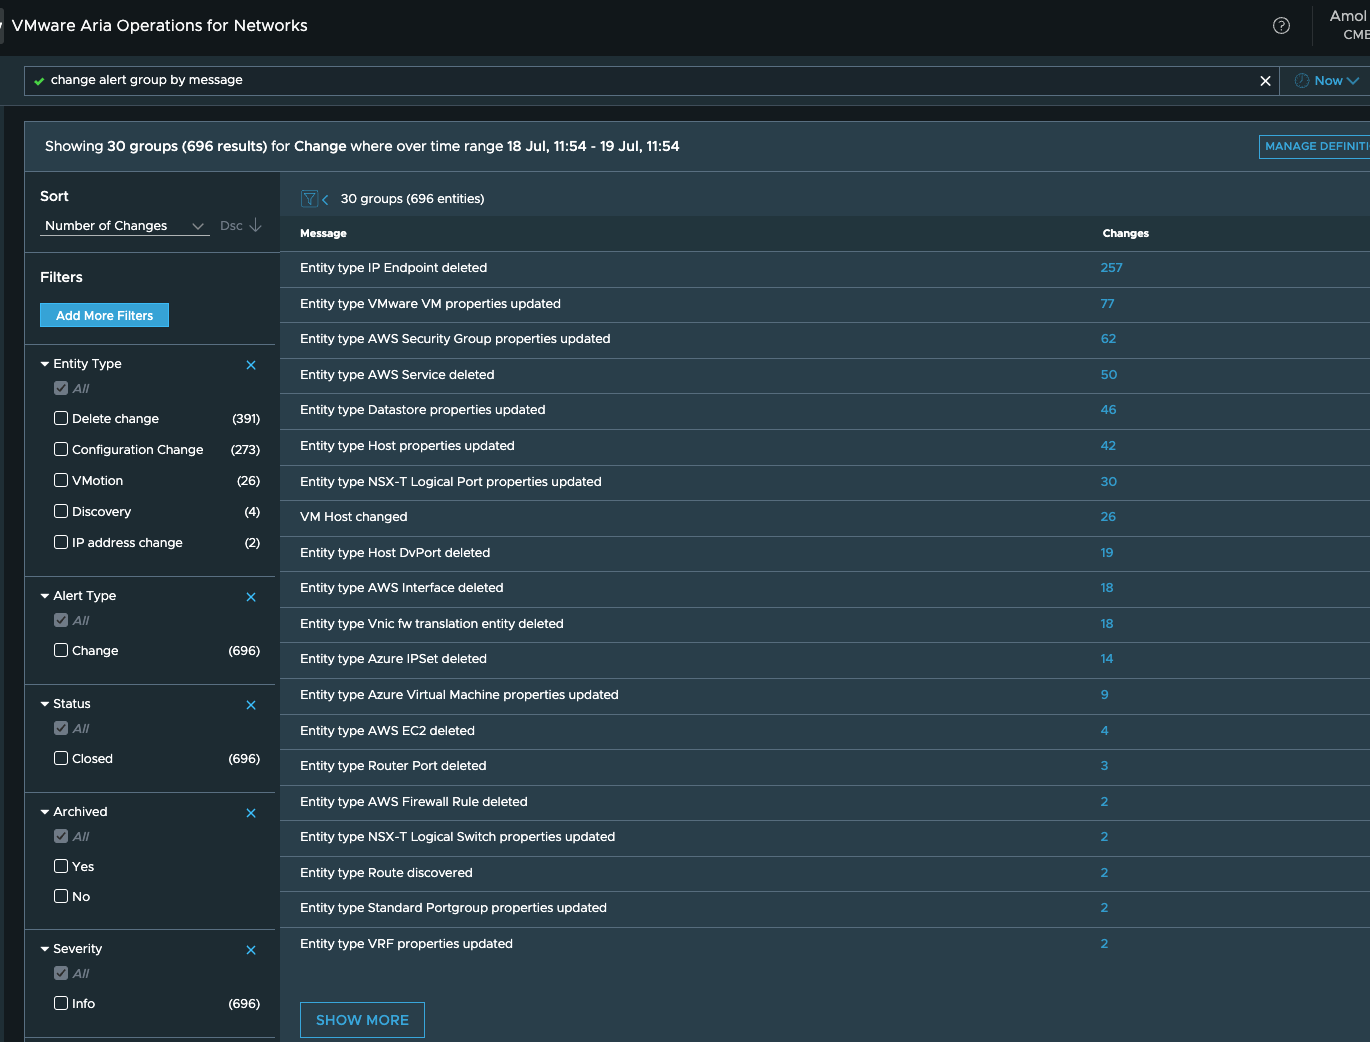
In above scenario, you notice that there are 77 changes associated with VMs, and may be that seems strange/unexpected to you, so you’d like to find out what exactly has changed for the VMs, so you can use a query like: “change alert where Message=’Entity type VMware VM properties updated’ group by changedProperties.propertyPath” which gives you an output like:
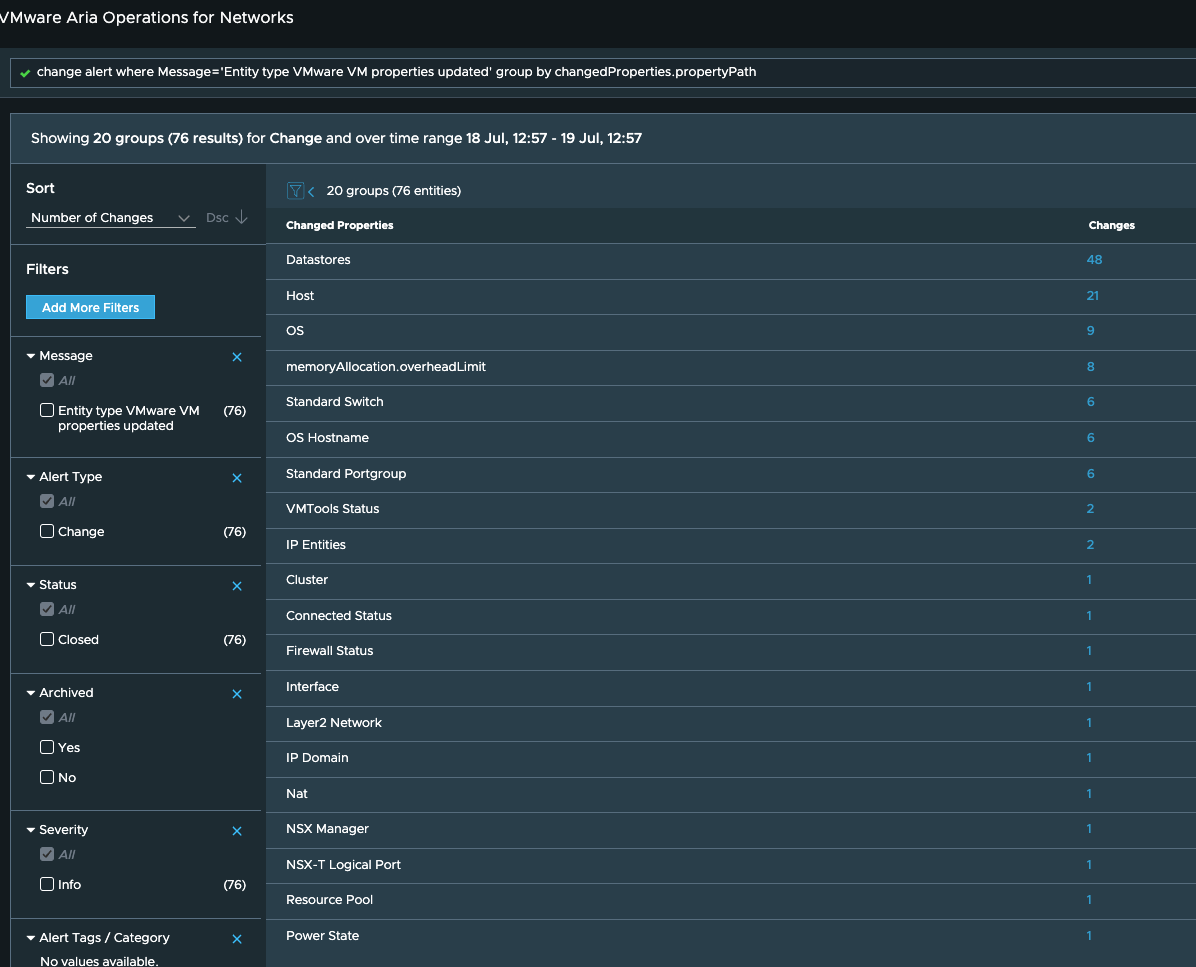
This gives you a much better idea of what has changed for the VMs and whether it is something you need to dig deeper into further.
Clicking on the number seen in the second column should give you the VMs for which the particular property has changed.
So when you want to monitor a critical environment, it can help if you create a custom dashboard of the change alerts for the relevant entities.
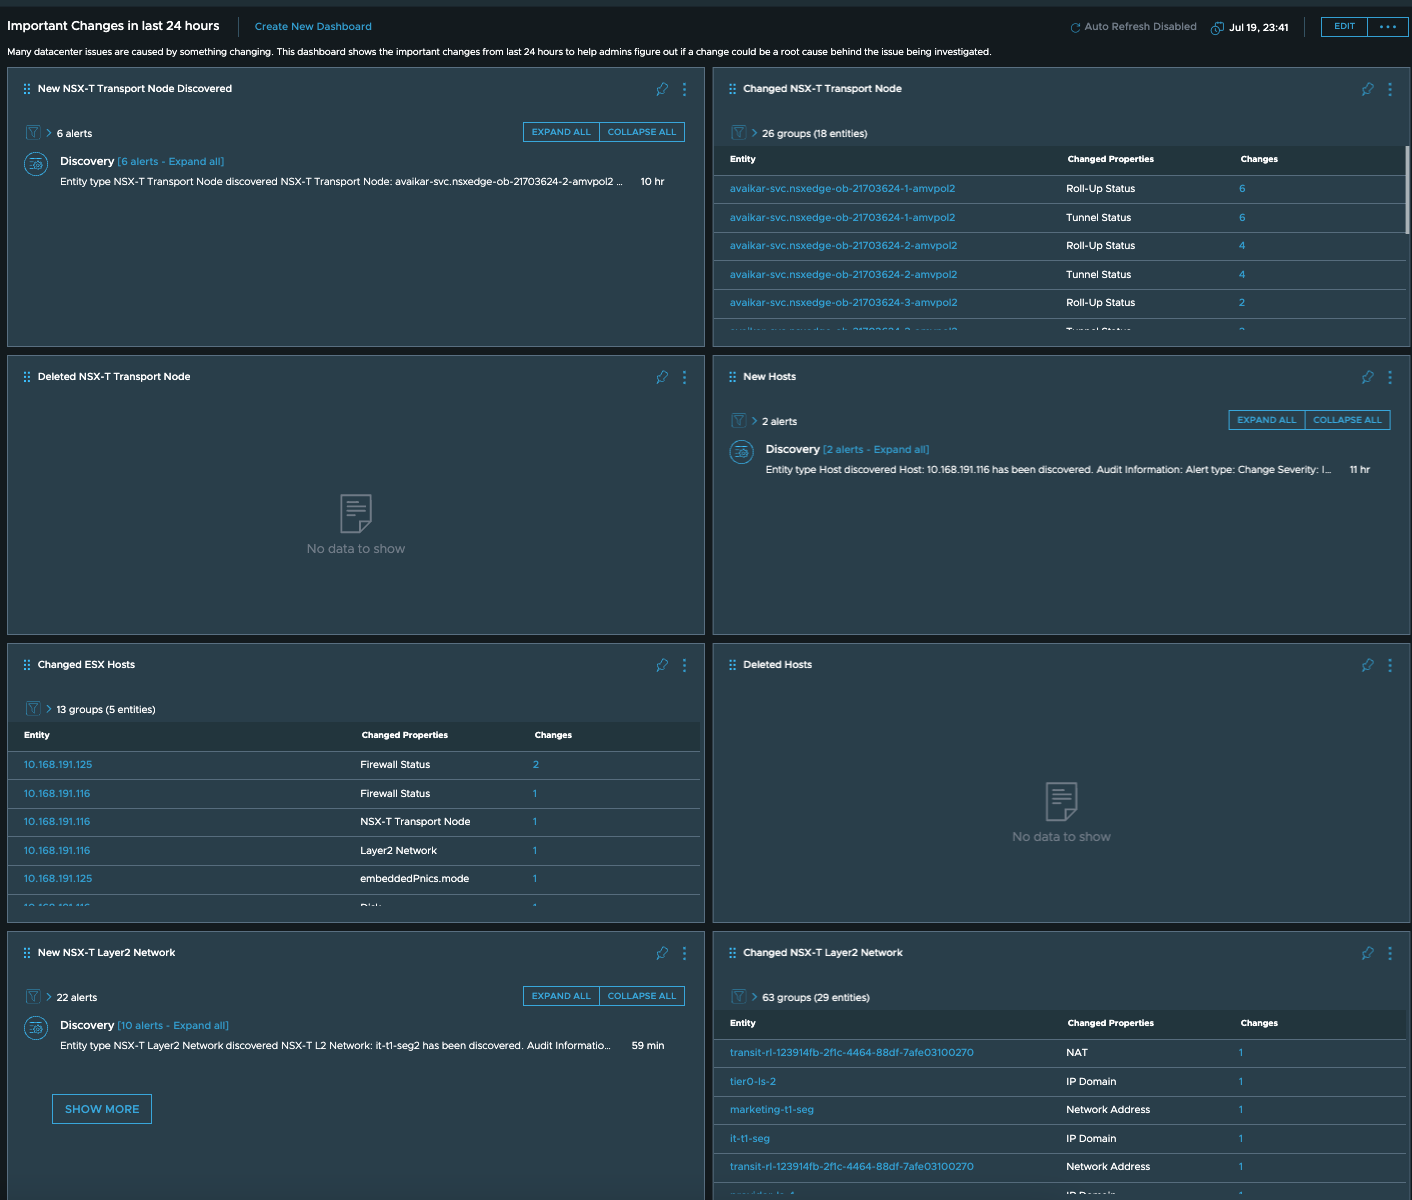
For instance, to keep a watch on unexpected changes in your NSX-T environment, you could create a dashboard using queries like:
"entity.name of change alert where message = 'Entity type NSX-T Transport Node discovered'"
"change alert where message = 'Entity type NSX-T Transport Node properties updated' group by entity, changedProperties.propertyPath"
“change alert where message = ‘Entity type Host properties updated’ group by entity, changedProperties.propertyPath”and so on. Now it can be tedious to figure out such queries and execute them manually on several setups where you’d need the dashboards.
This is where the vRNI Dashboard Exchange comes into picture.
Using the dashboard exchange tool and definitions, you can create detailed dashboards like the one below in a matter of minutes:
To find more about the vRNI Dashboard Exchange, check this blog out:
https://vrniblog.github.io/2023/07/14/vRNI-Dashboard-Exchange.html
Feel free to reach out to us if you need any more information about change tracking and alerting in vRNI and how you can use it to your benefit.
- https://www.theregister.co.uk/2019/03/14/facebook_server_configuration
- https://www.evolven.com/blog/configuration-change-causes-azure-cloud-outage.html